Getting Started
UptimeChecker is a lightweight, reliable monitoring tool designed specifically for developers using free-tier infrastructure. It ensures your side projects never sleep by sending perfectly timed heartbeats.
How it works
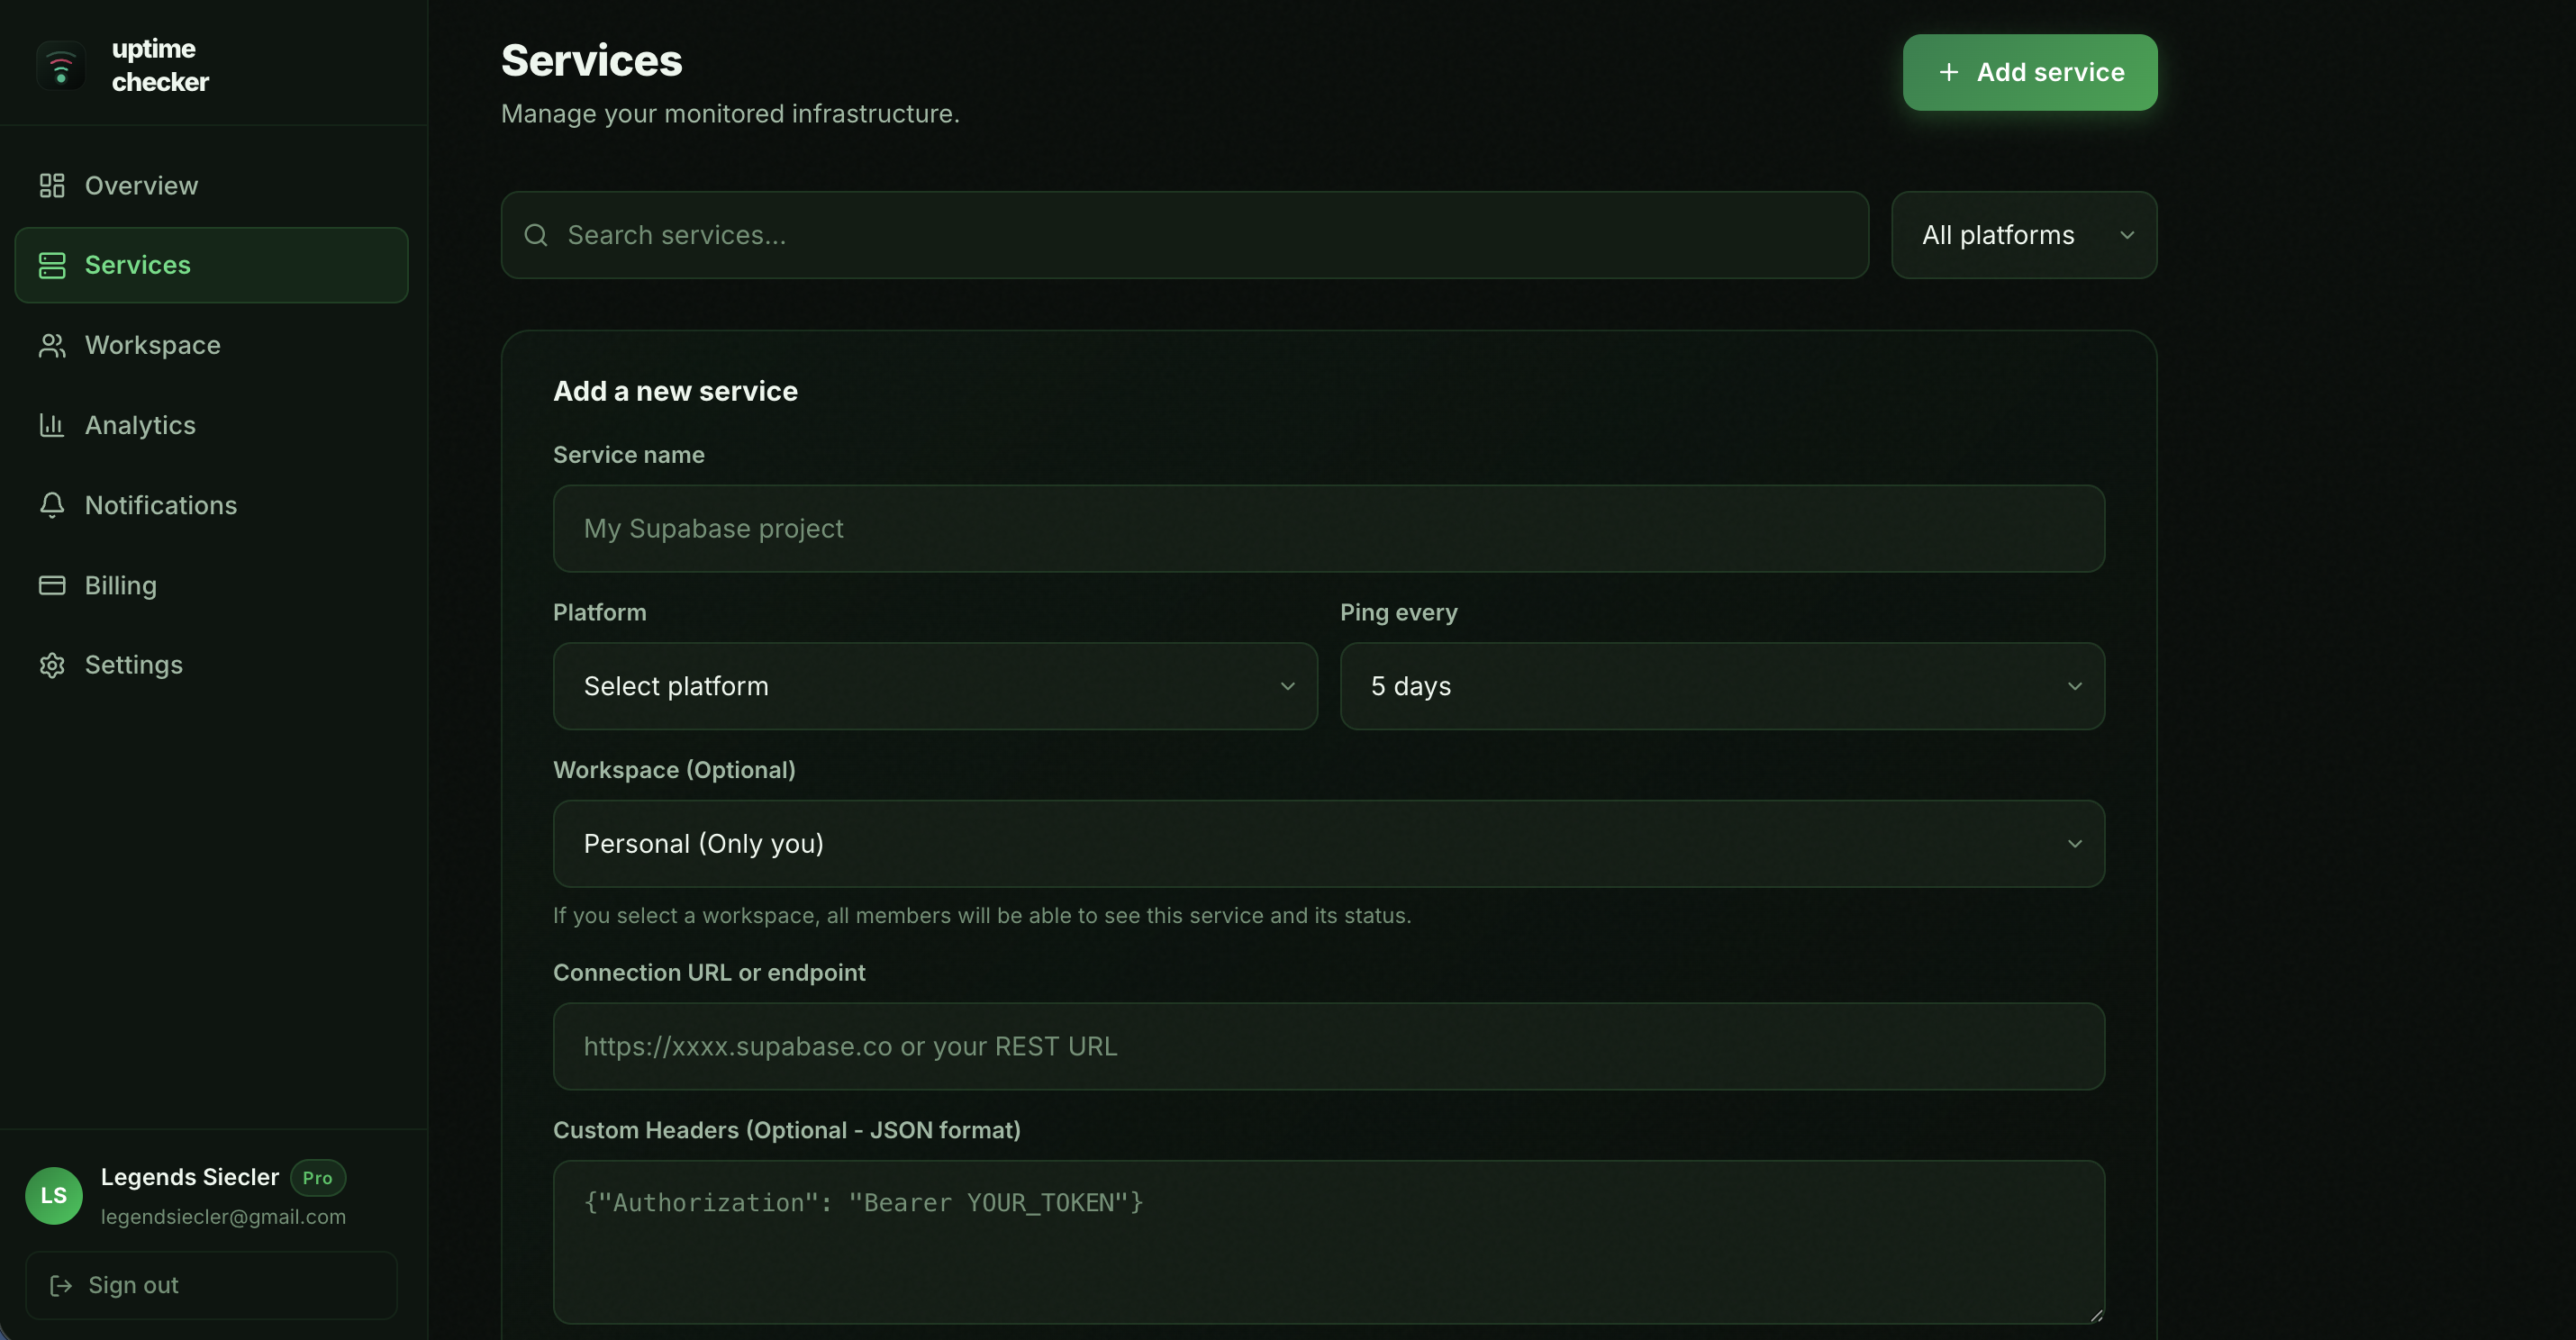
1. Add Endpoint
Paste your project URL or API endpoint.
2. Set Schedule
Choose a ping interval (e.g., every 5 days).
3. Background Pings
We automatically send lightweight GET requests.
4. Stay Awake
Your free-tier services never spin down or pause.
Adding Services
You can monitor any HTTP or HTTPS endpoint. This includes REST APIs, static websites, database endpoints, and Redis caches.
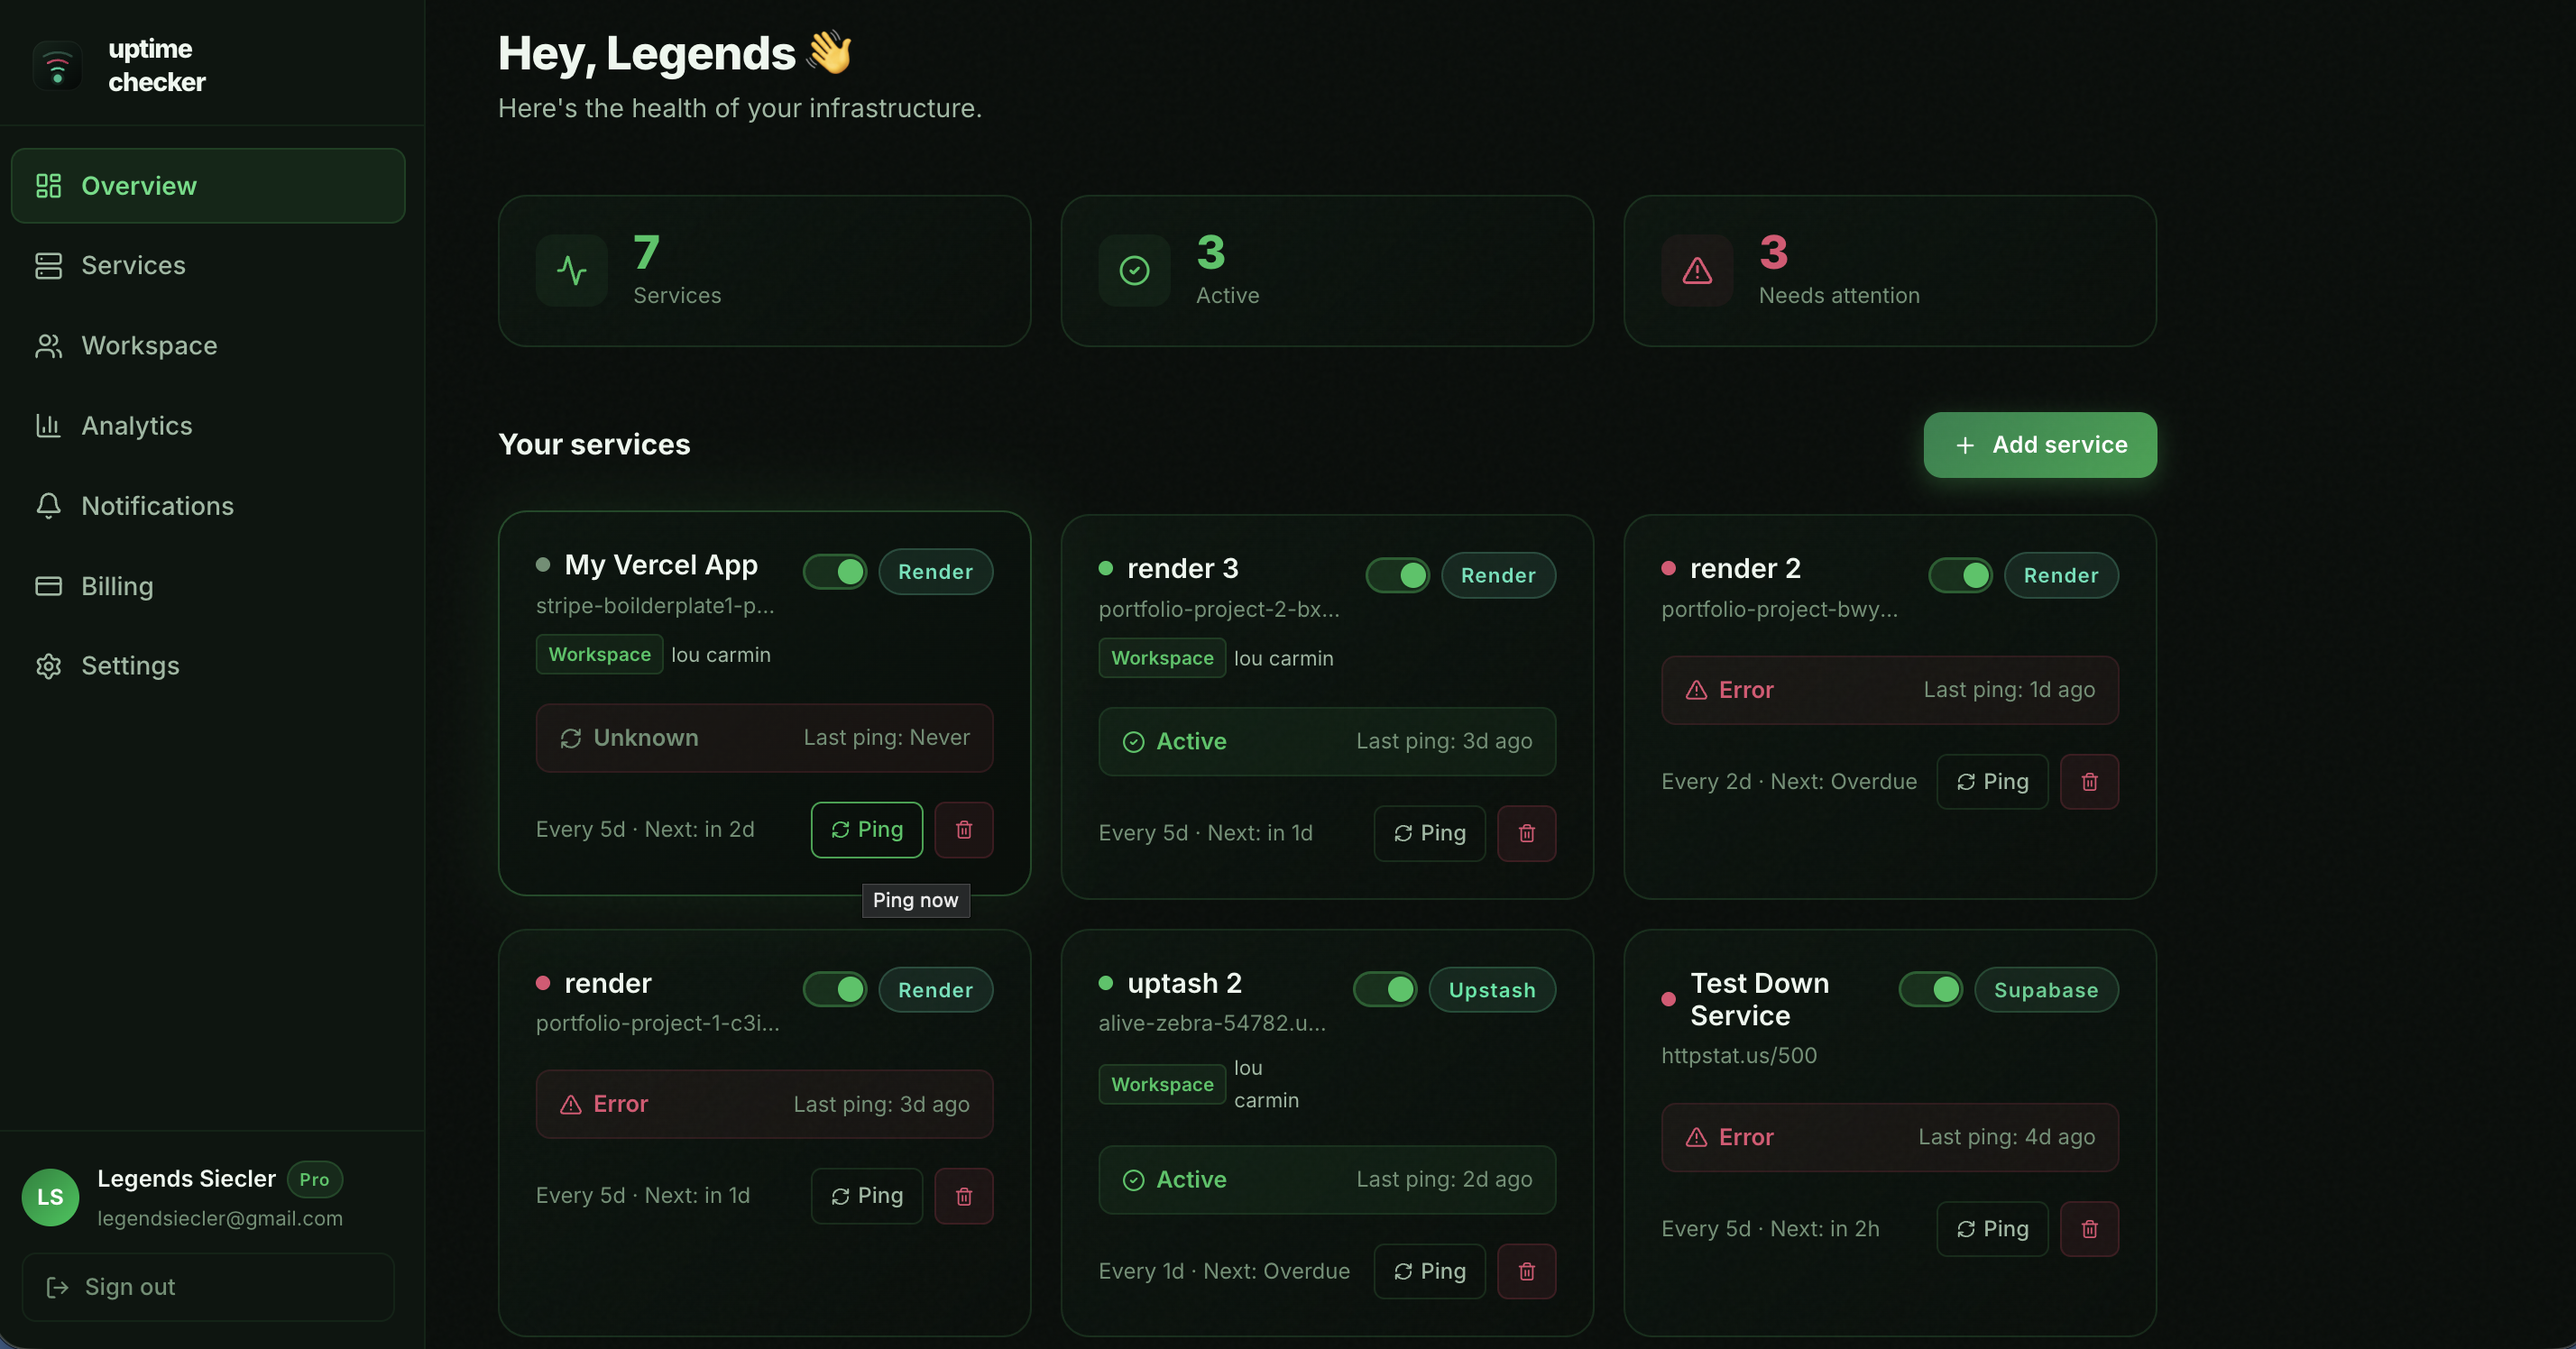
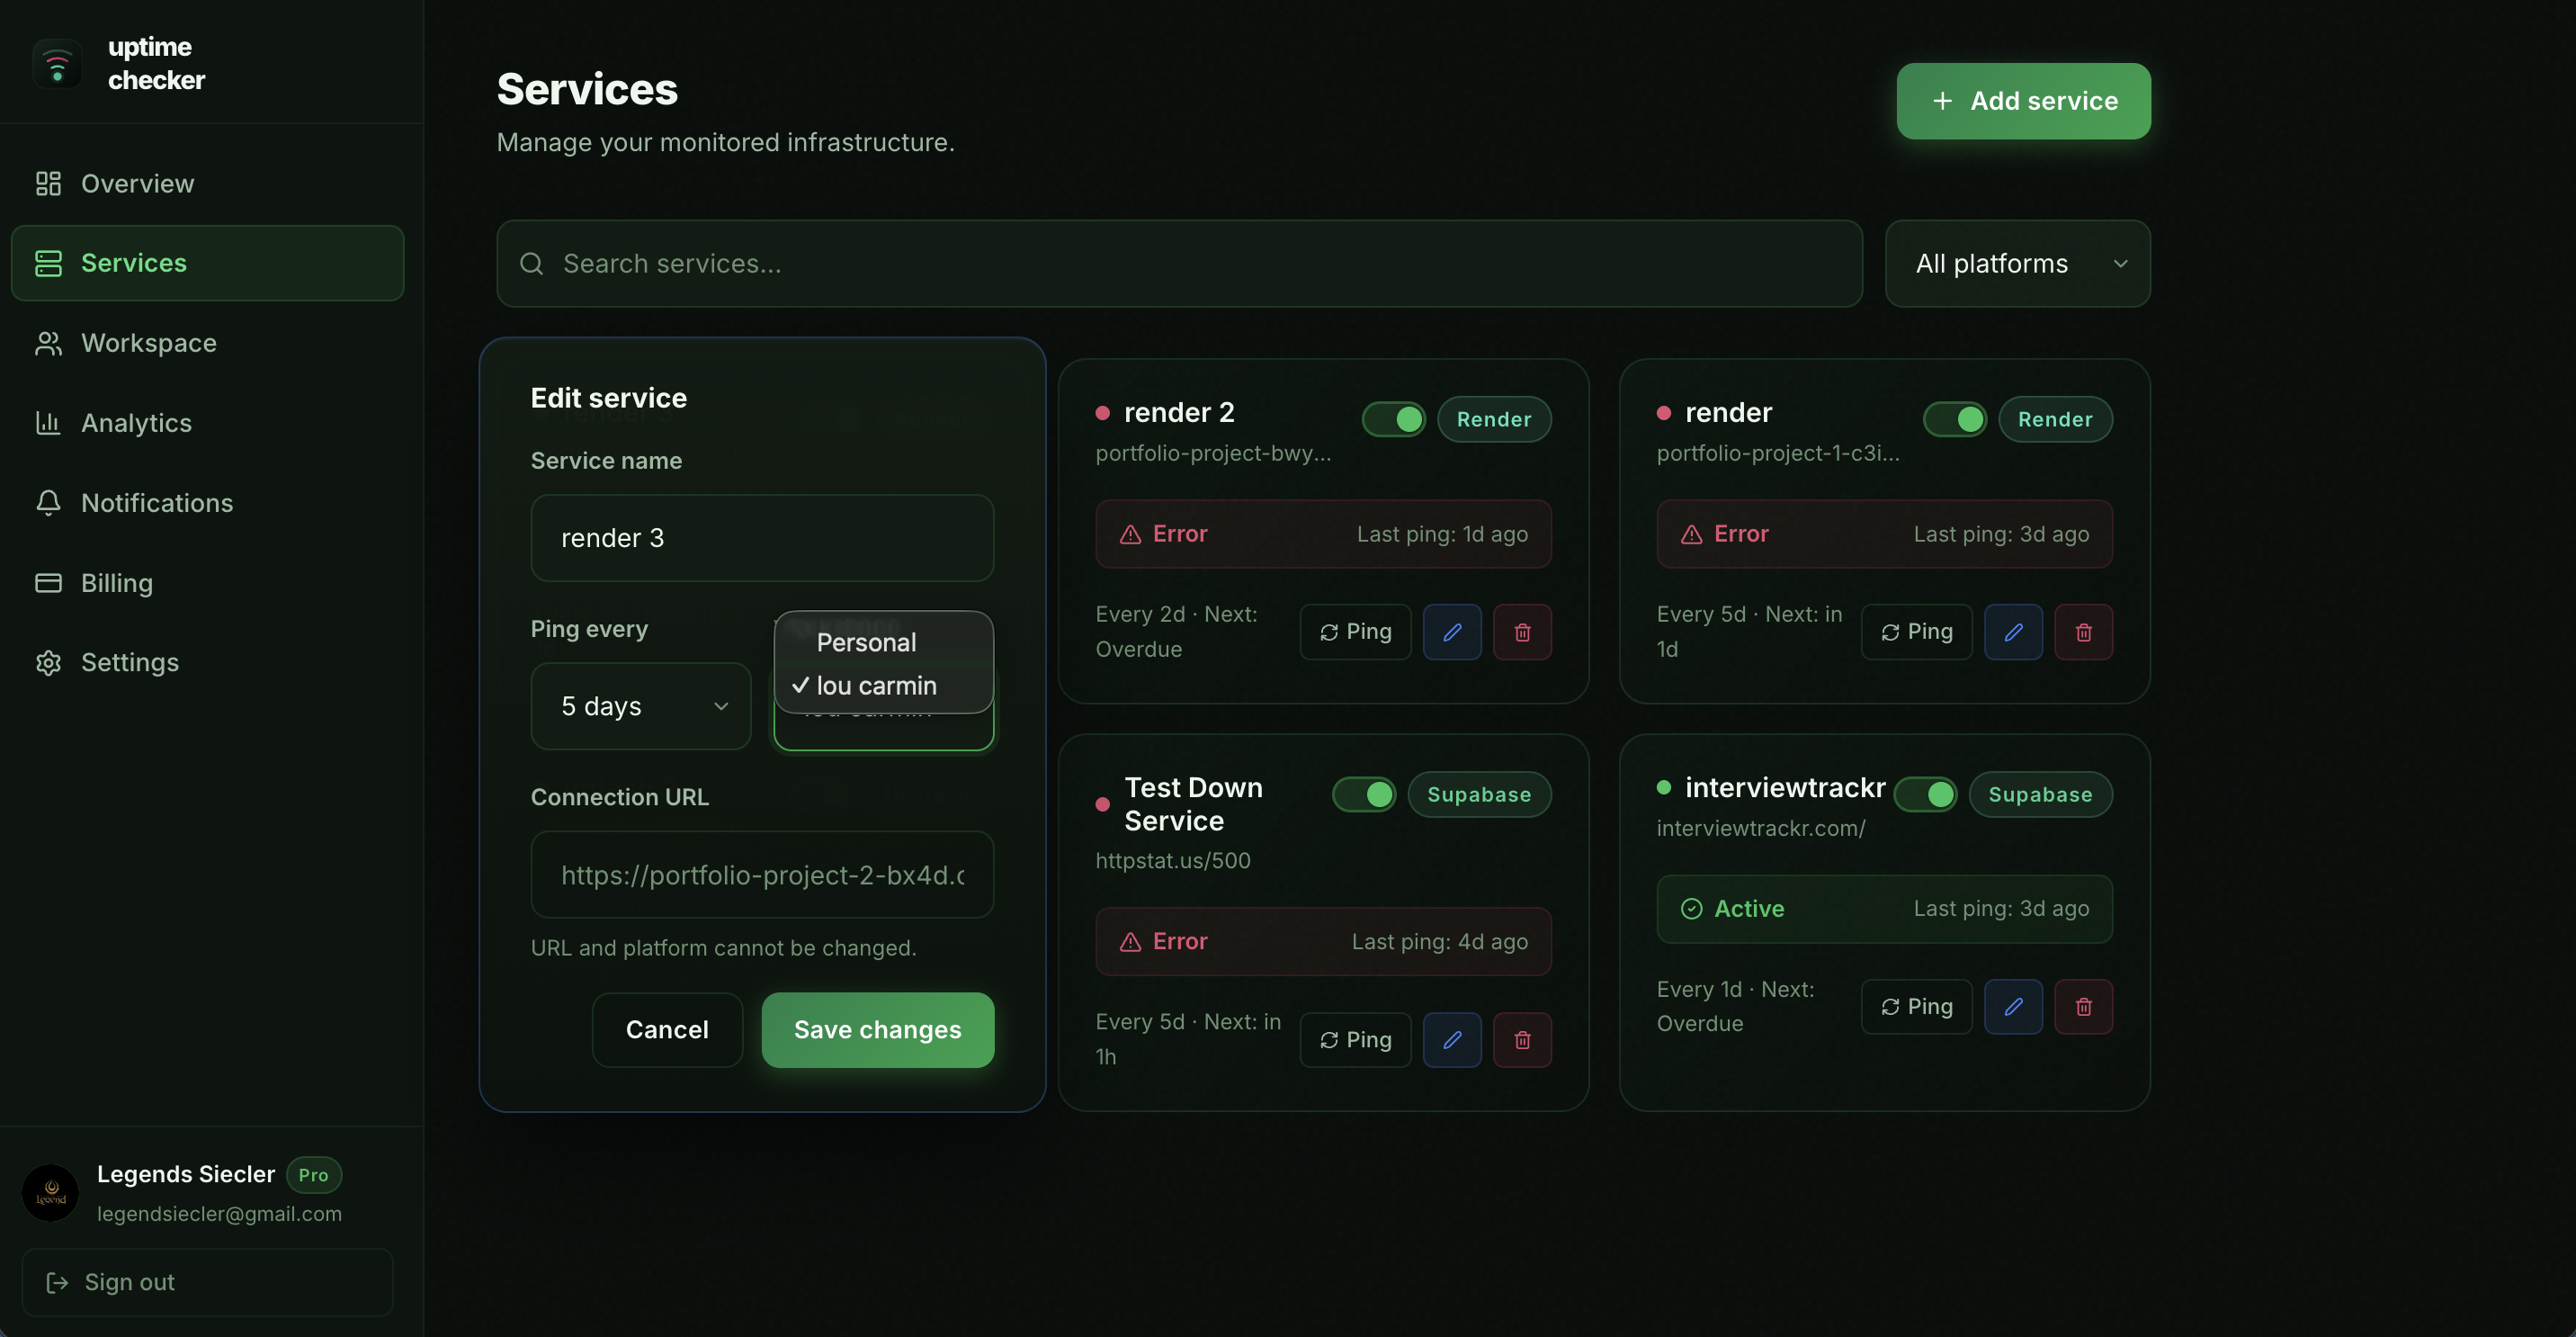
Managing Services
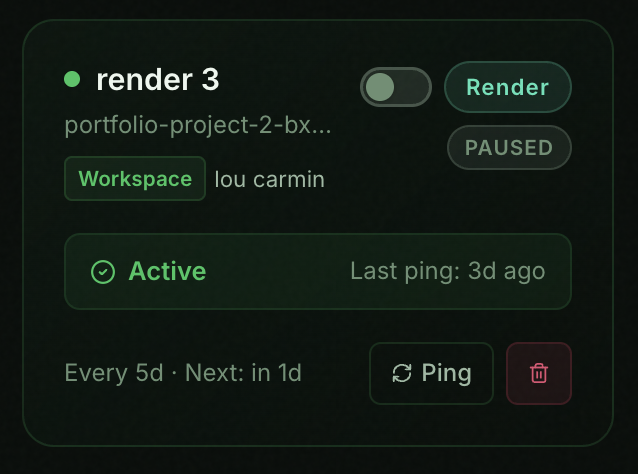
Active vs. Paused
You can easily toggle services between active and paused states. A paused service will not be pinged and will not trigger alerts. This is perfect for temporarily taking down a project for maintenance without losing your configuration.
Manual Pings
Need to verify a service immediately? Use the manual "Ping" button on any service card. There is a short 30-second cooldown between manual pings to prevent abuse.
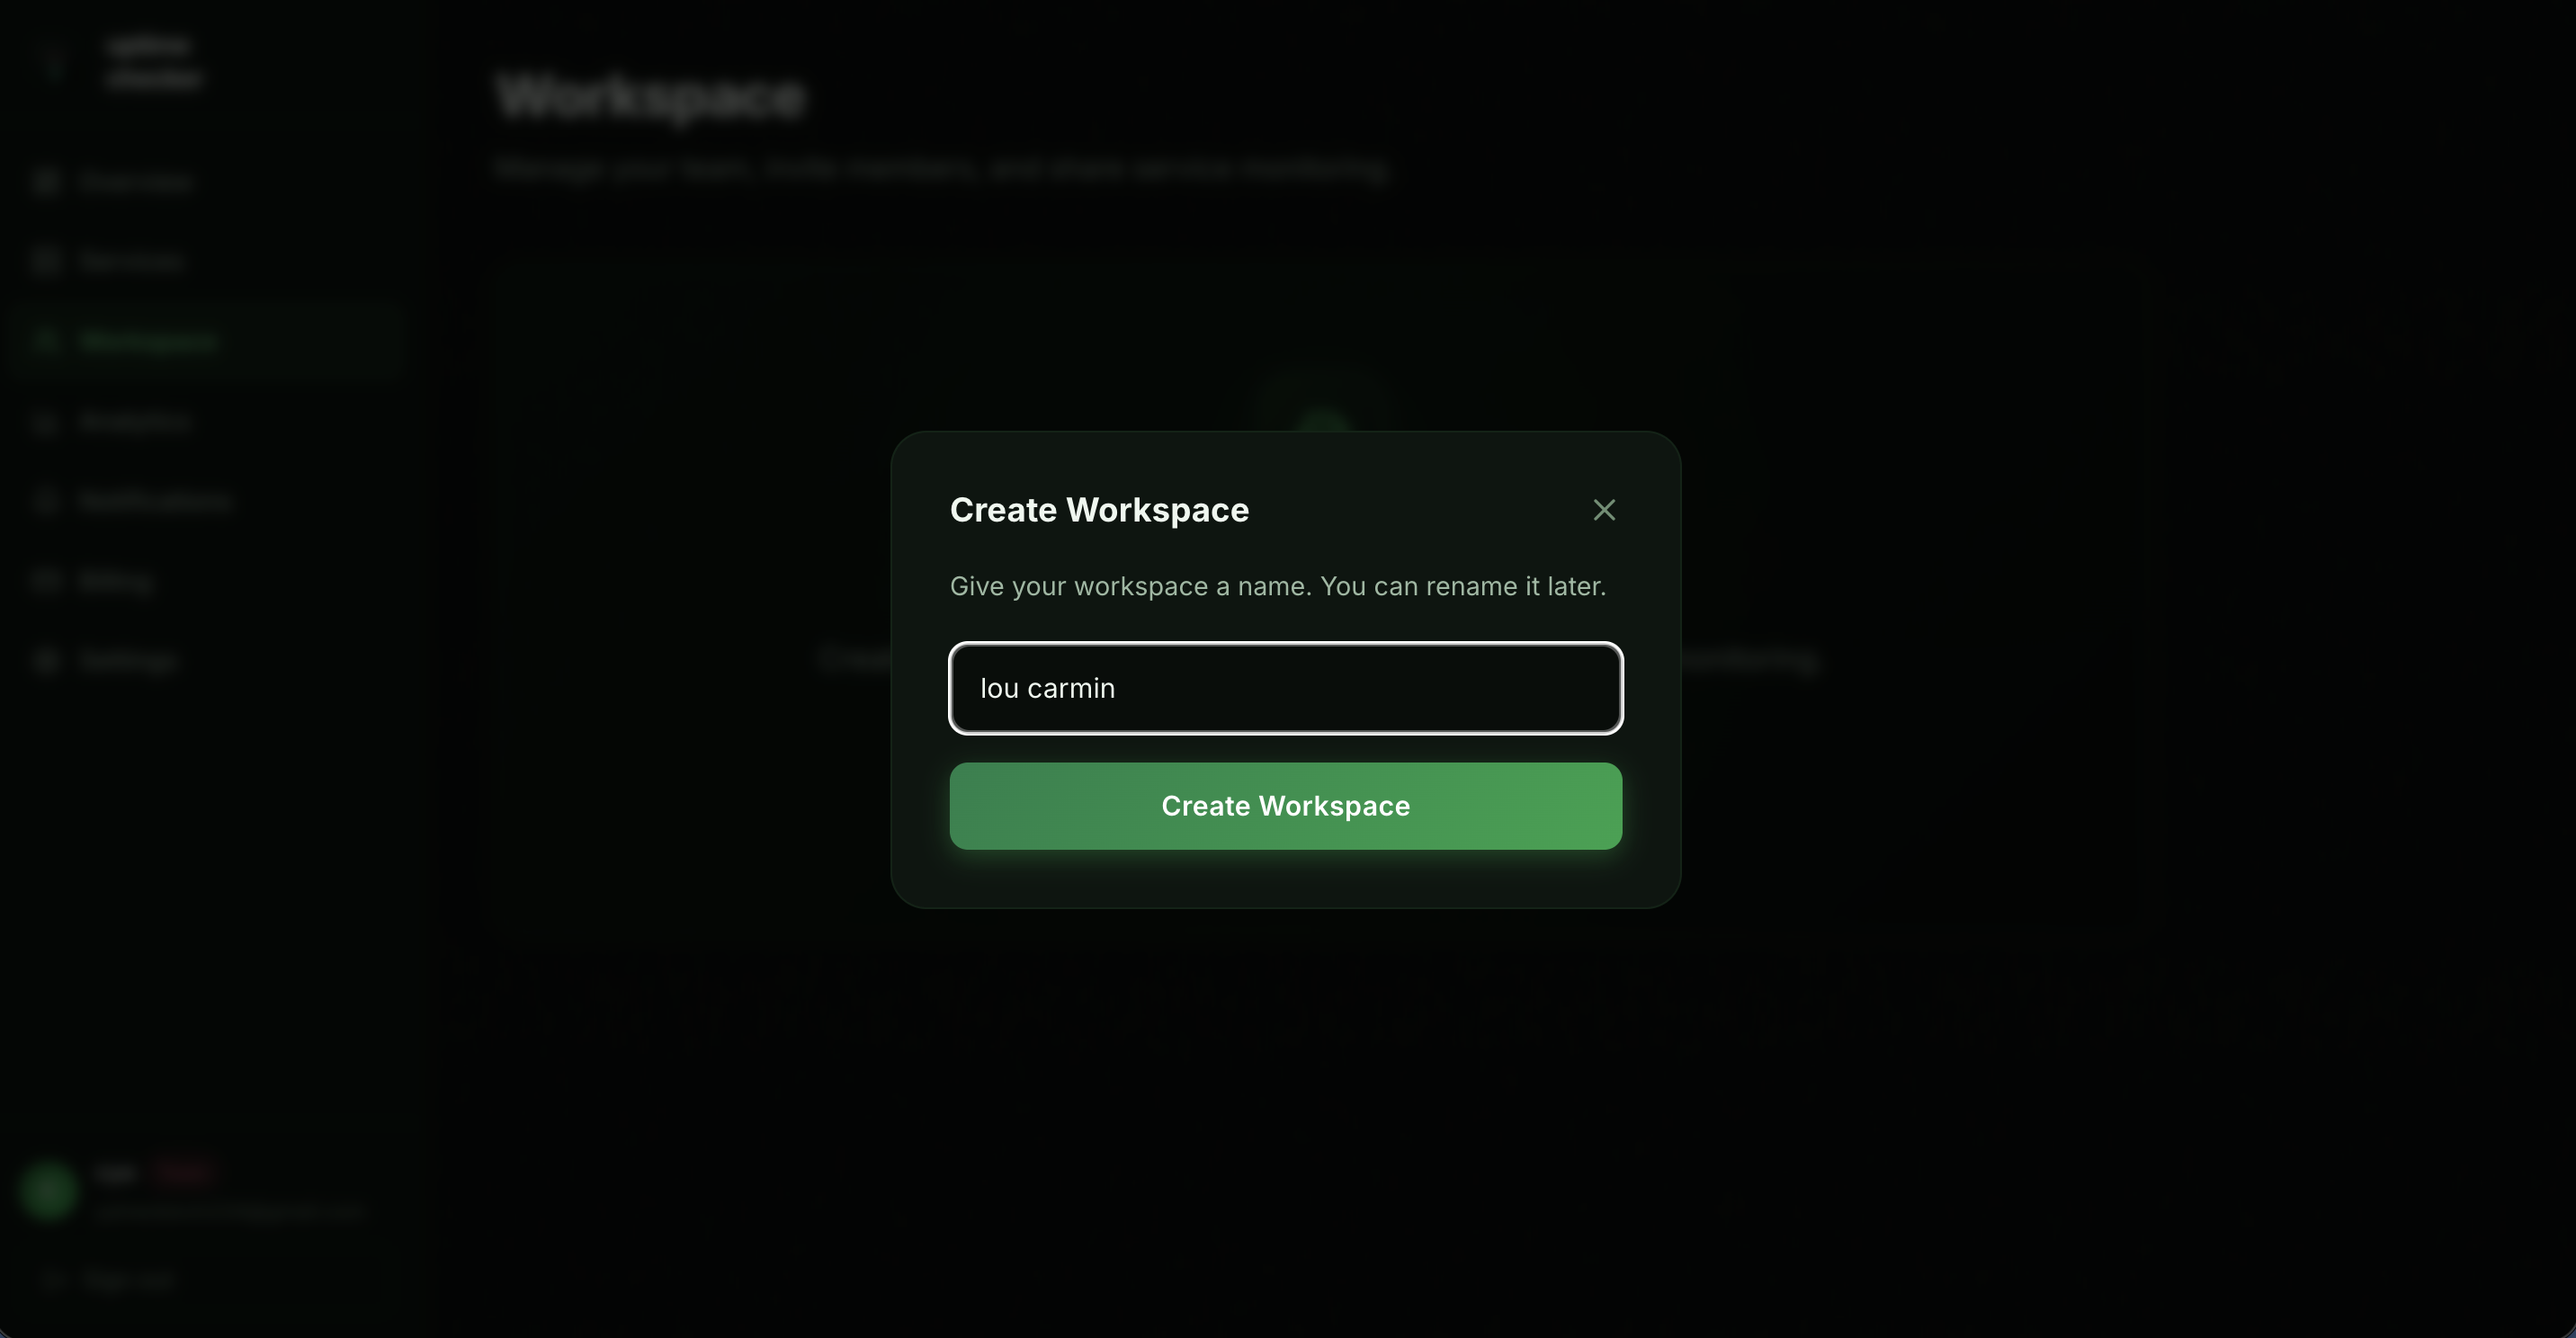
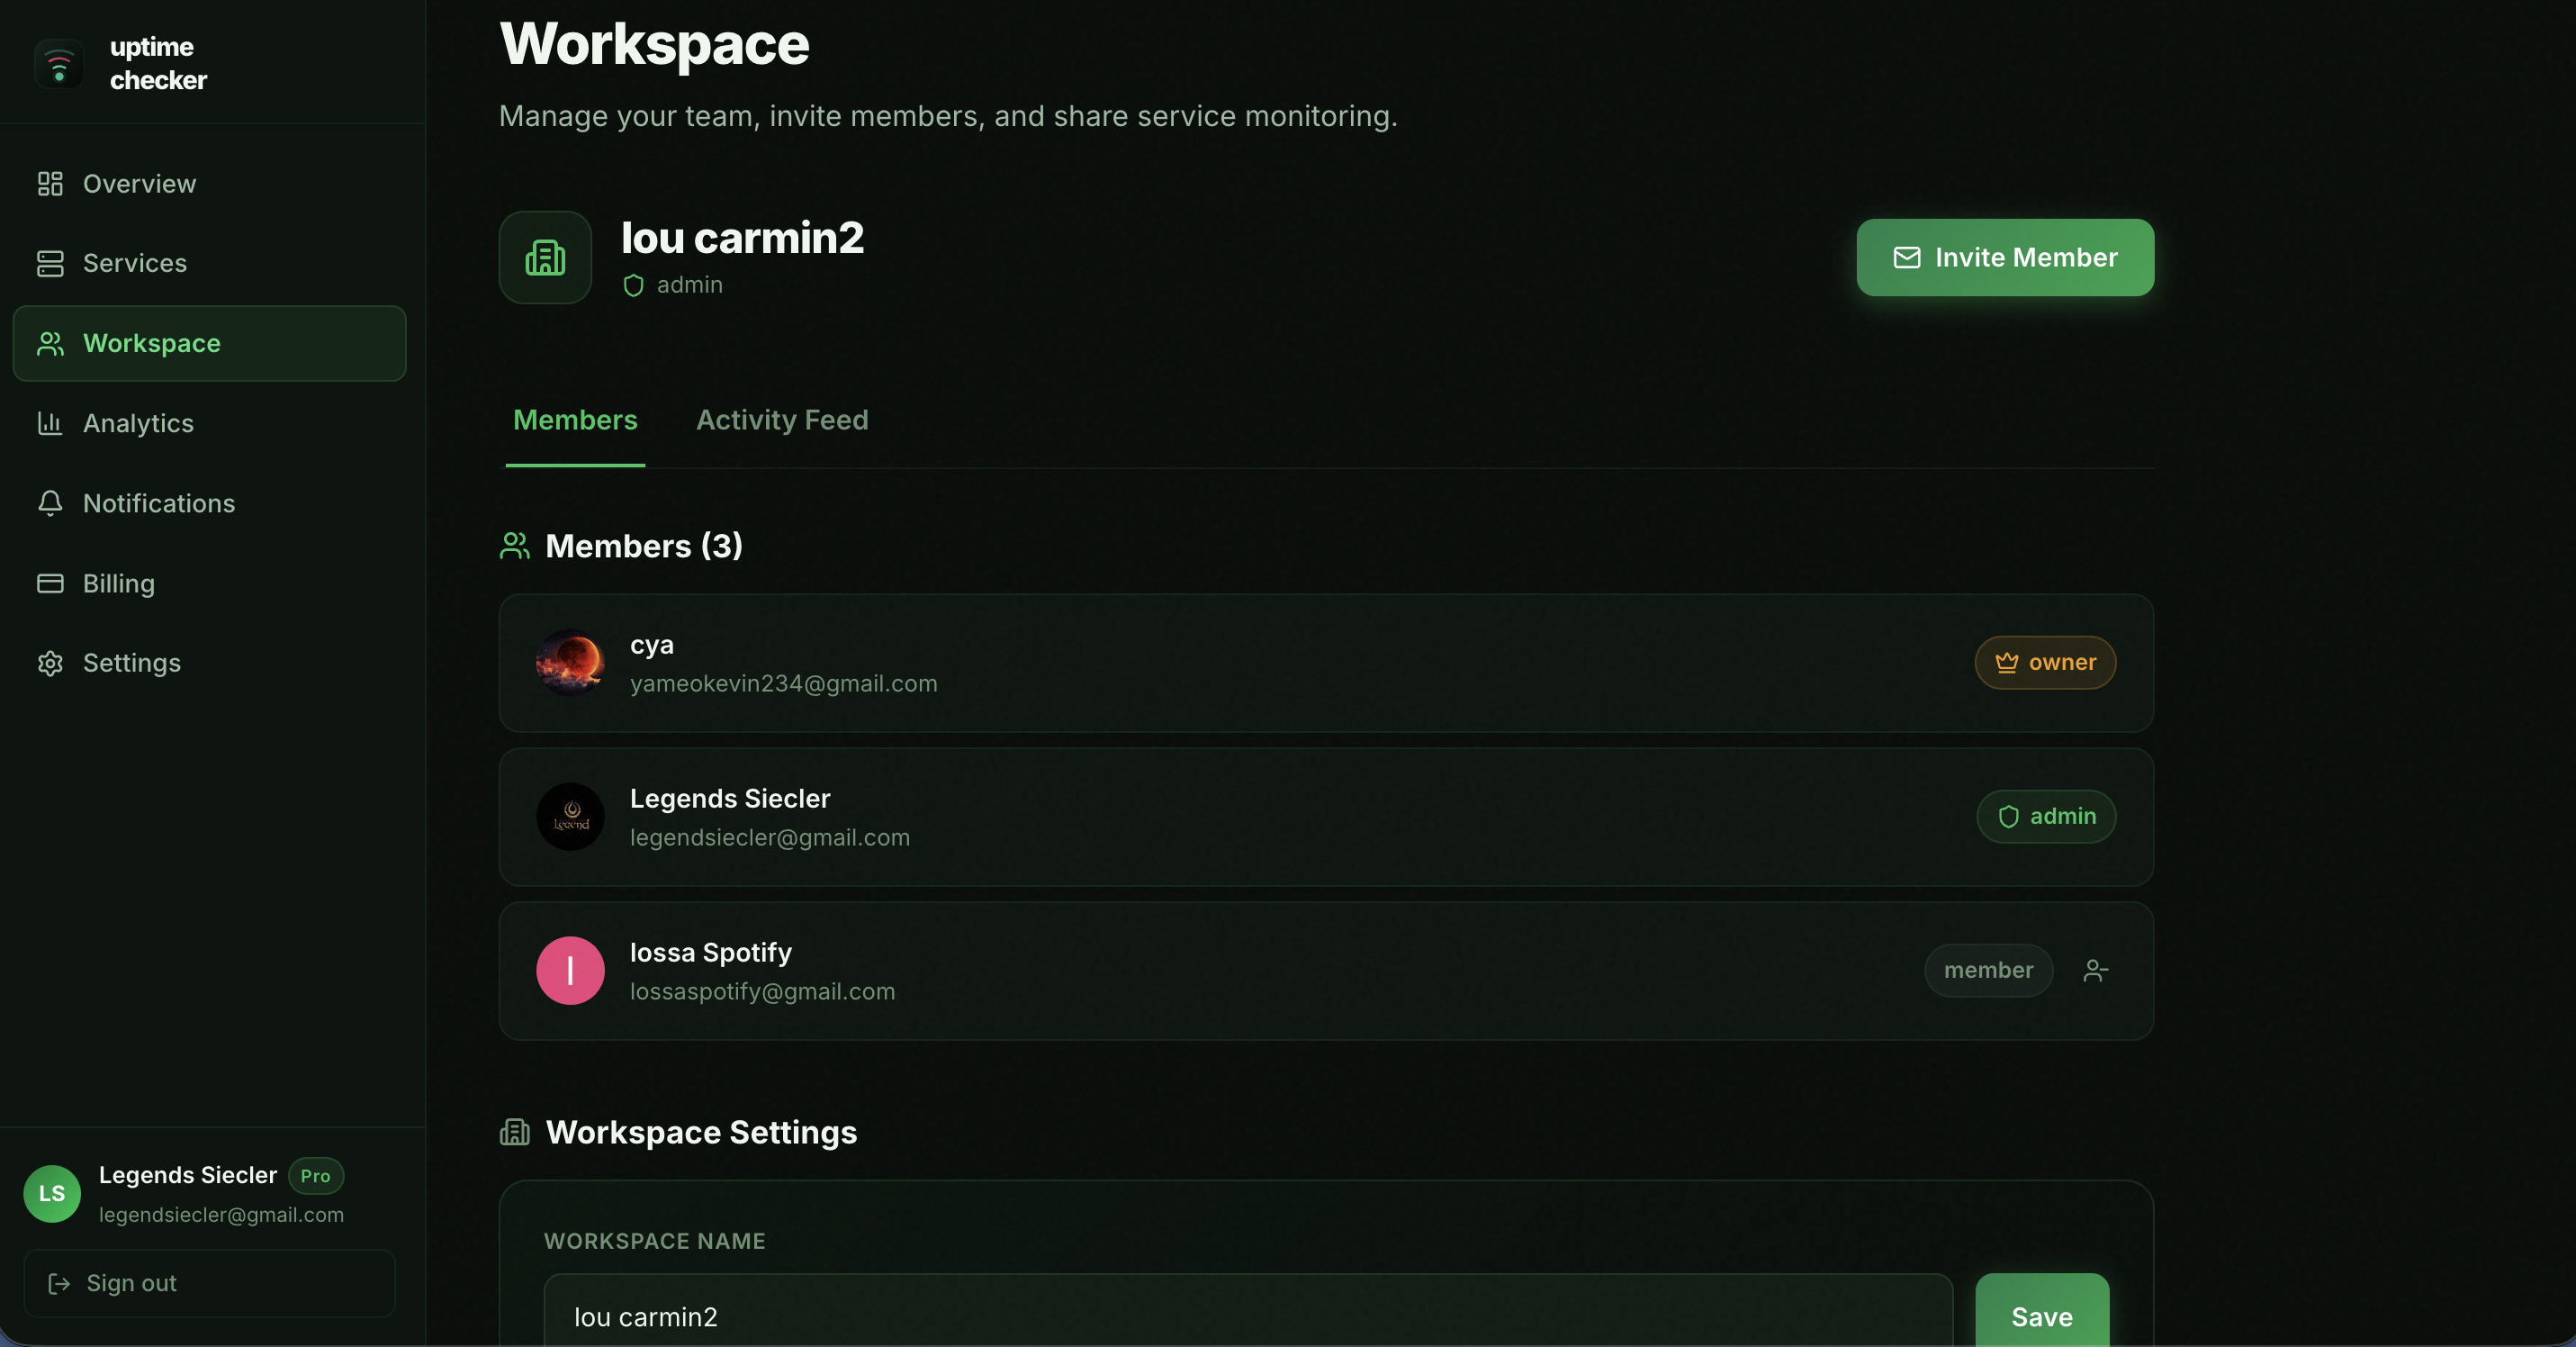
Team Workspaces
Collaboration is at the heart of the Team plan. Workspaces allow you to invite team members, share services, and manage access roles in a unified environment.
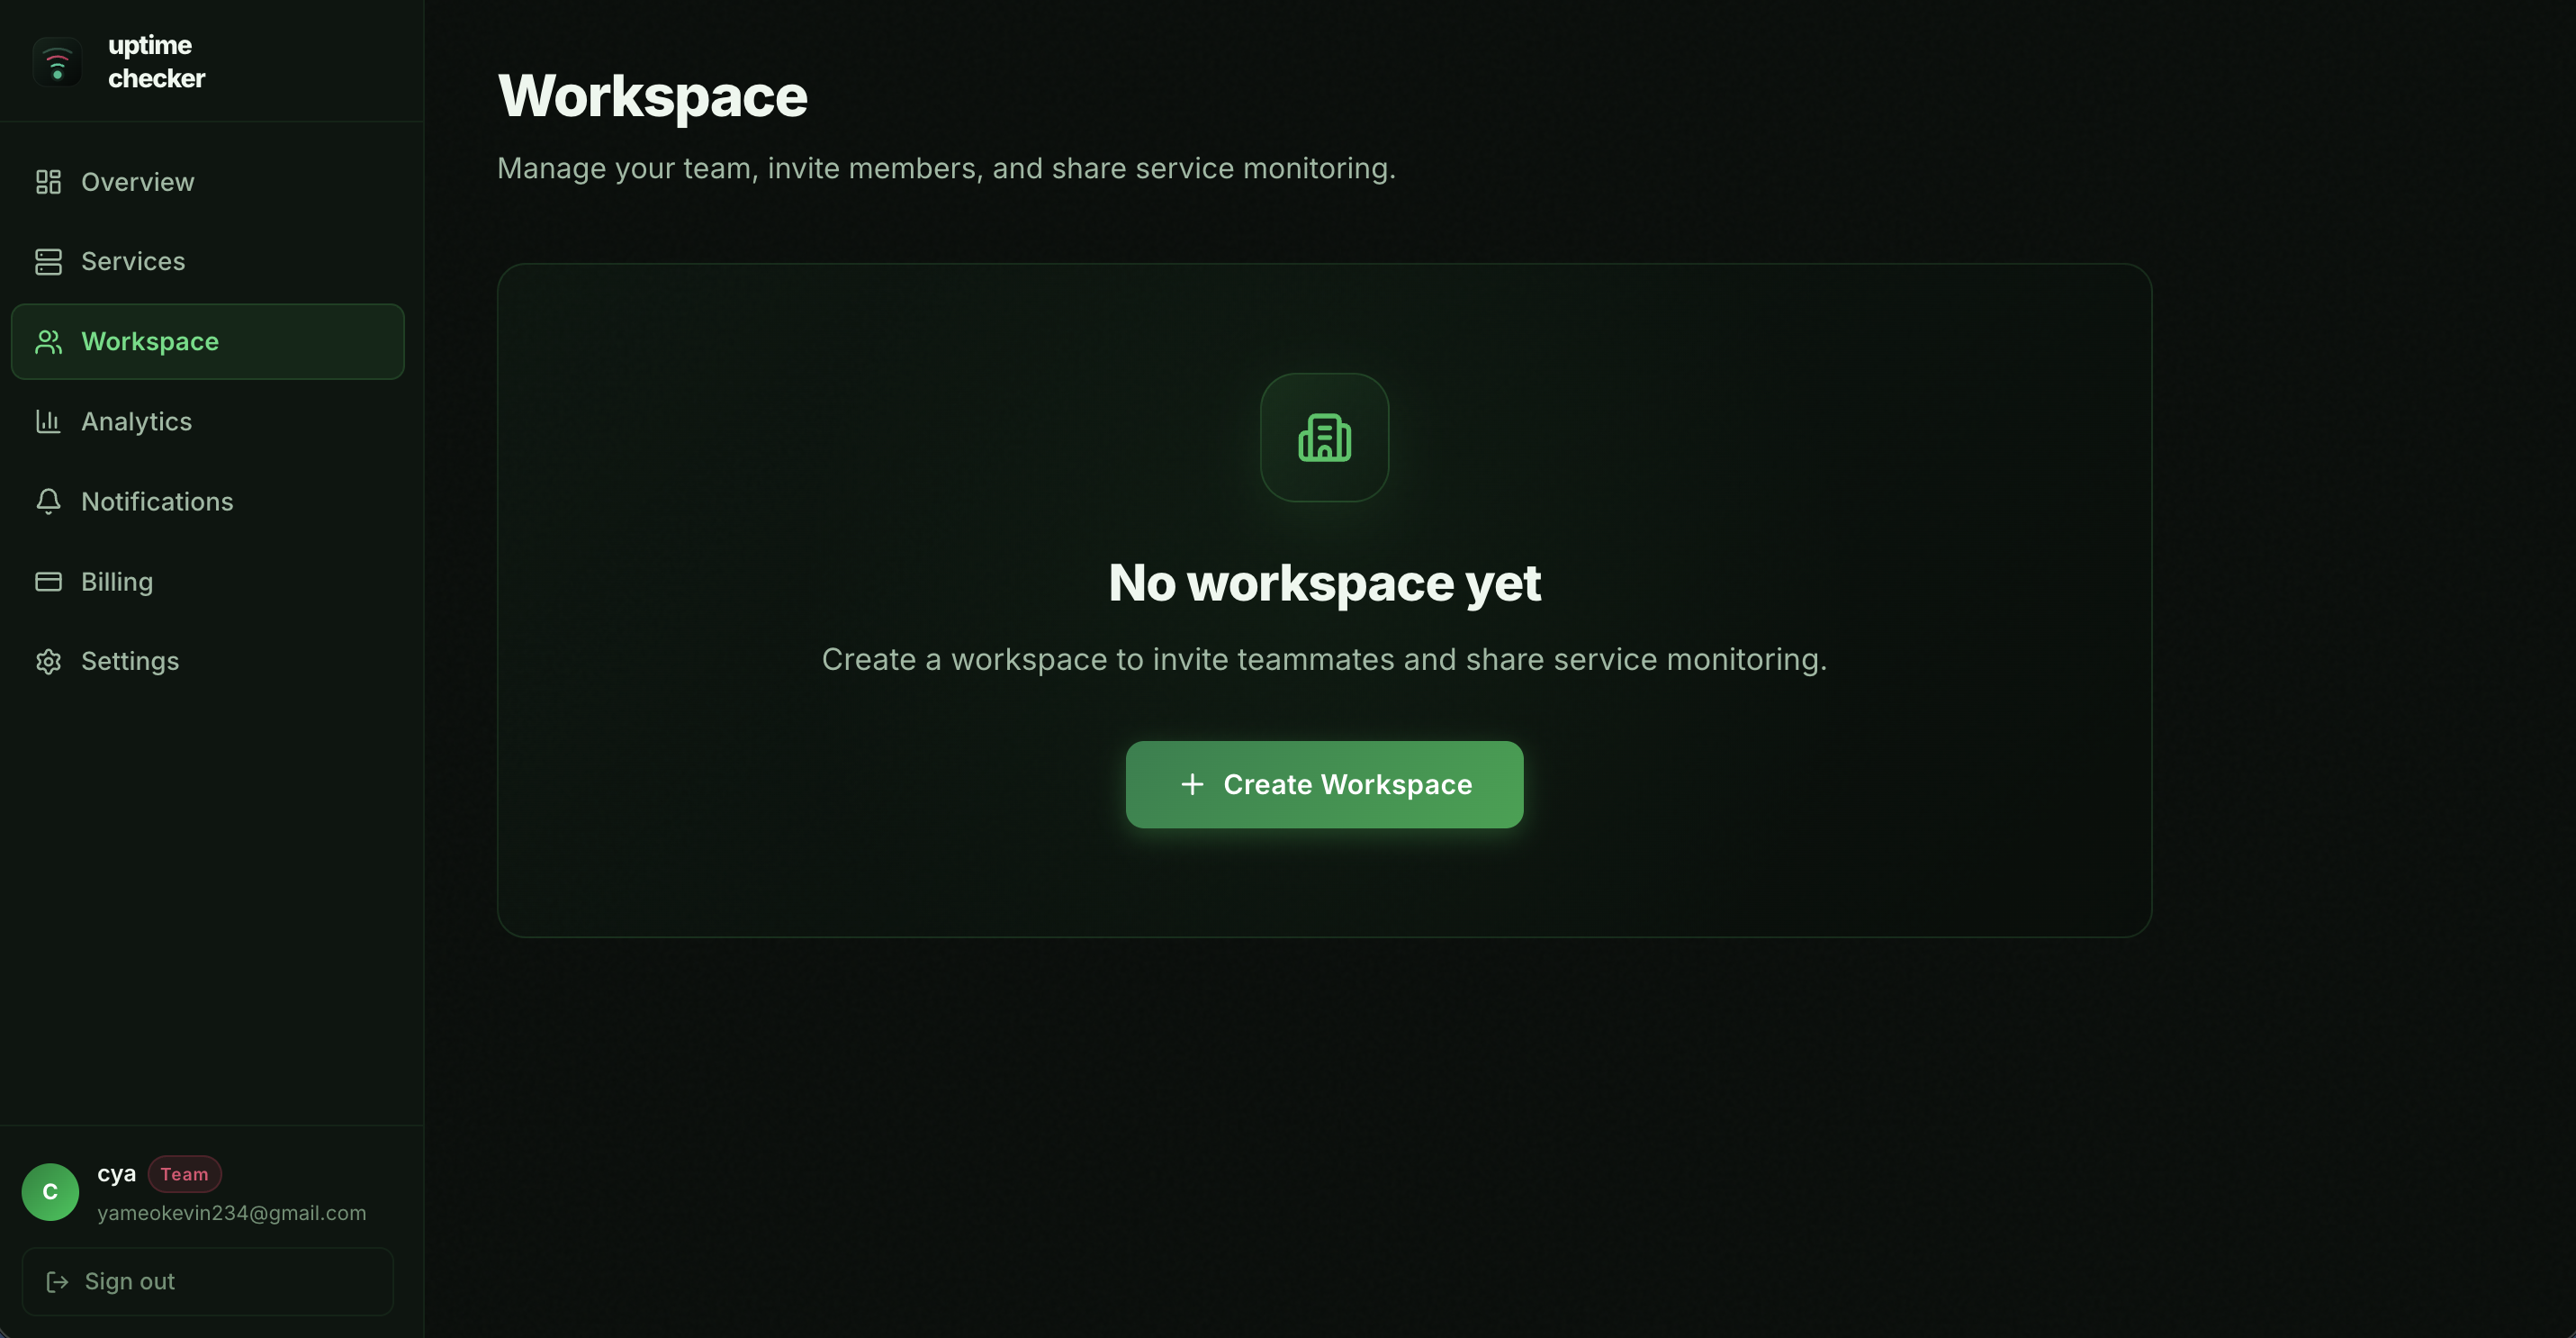
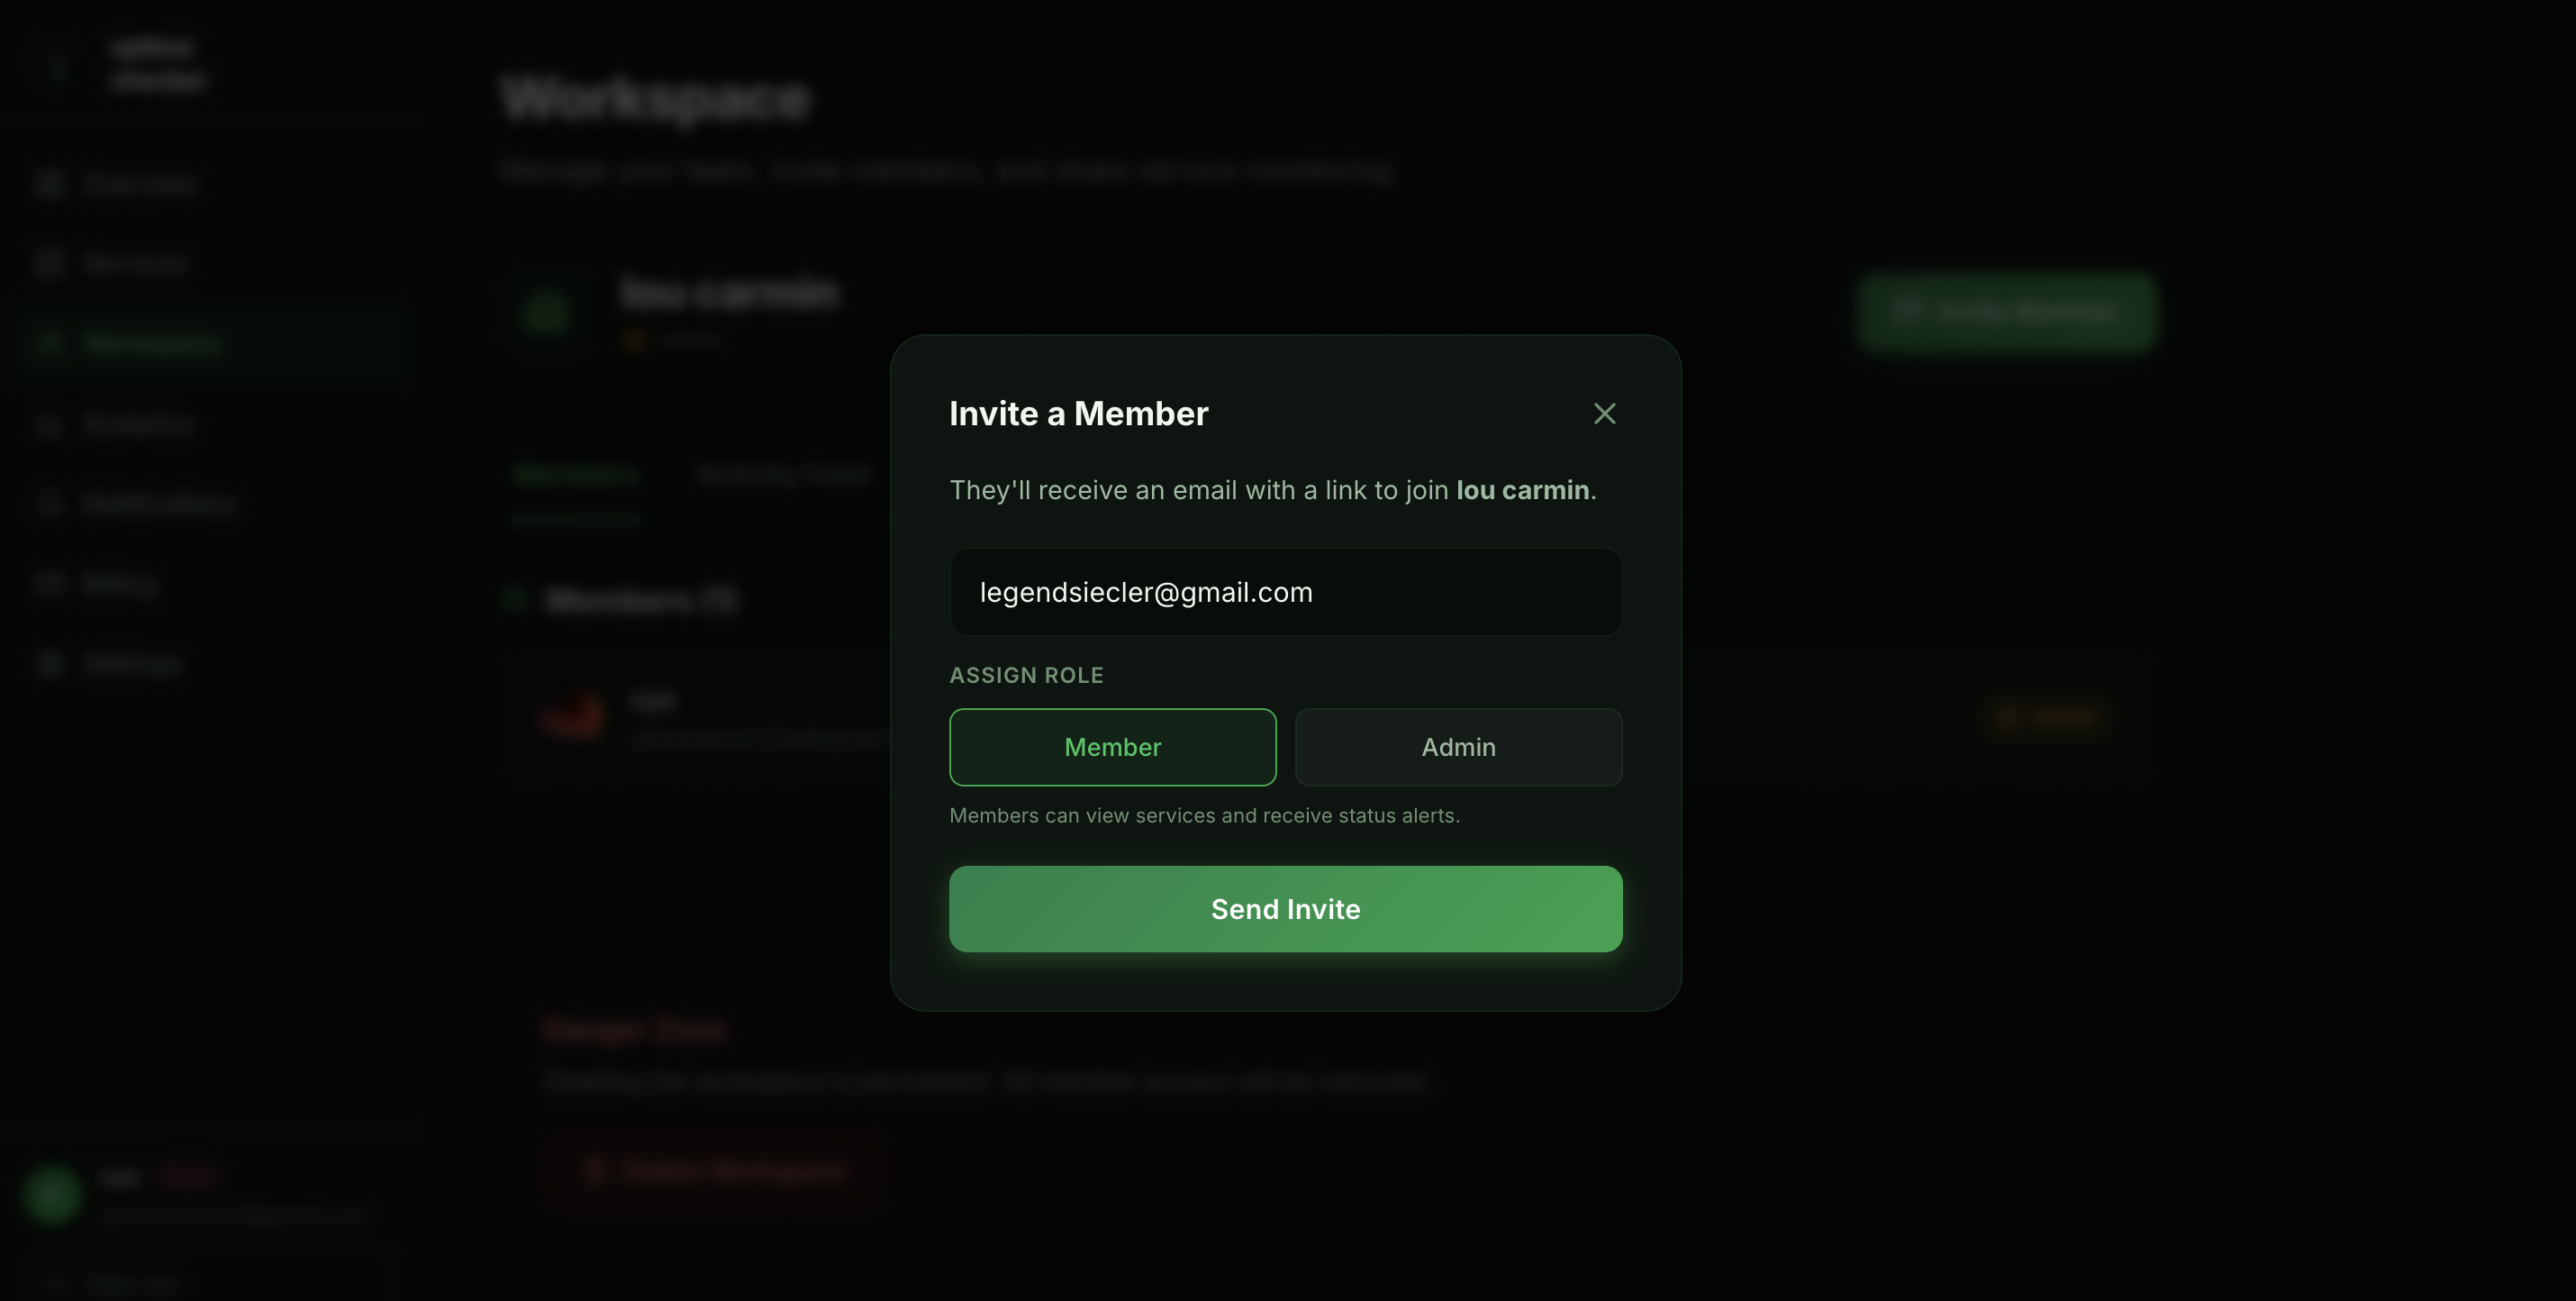
Inviting Team Members
Inviting a new member is simple. Just enter their email and assign a role (Admin or Member). They will receive an invitation link that allows them to join your workspace instantly.
- •Admin: Can manage services, invite members, and update settings.
- •Member: Can view services, receive alerts, and trigger manual pings.
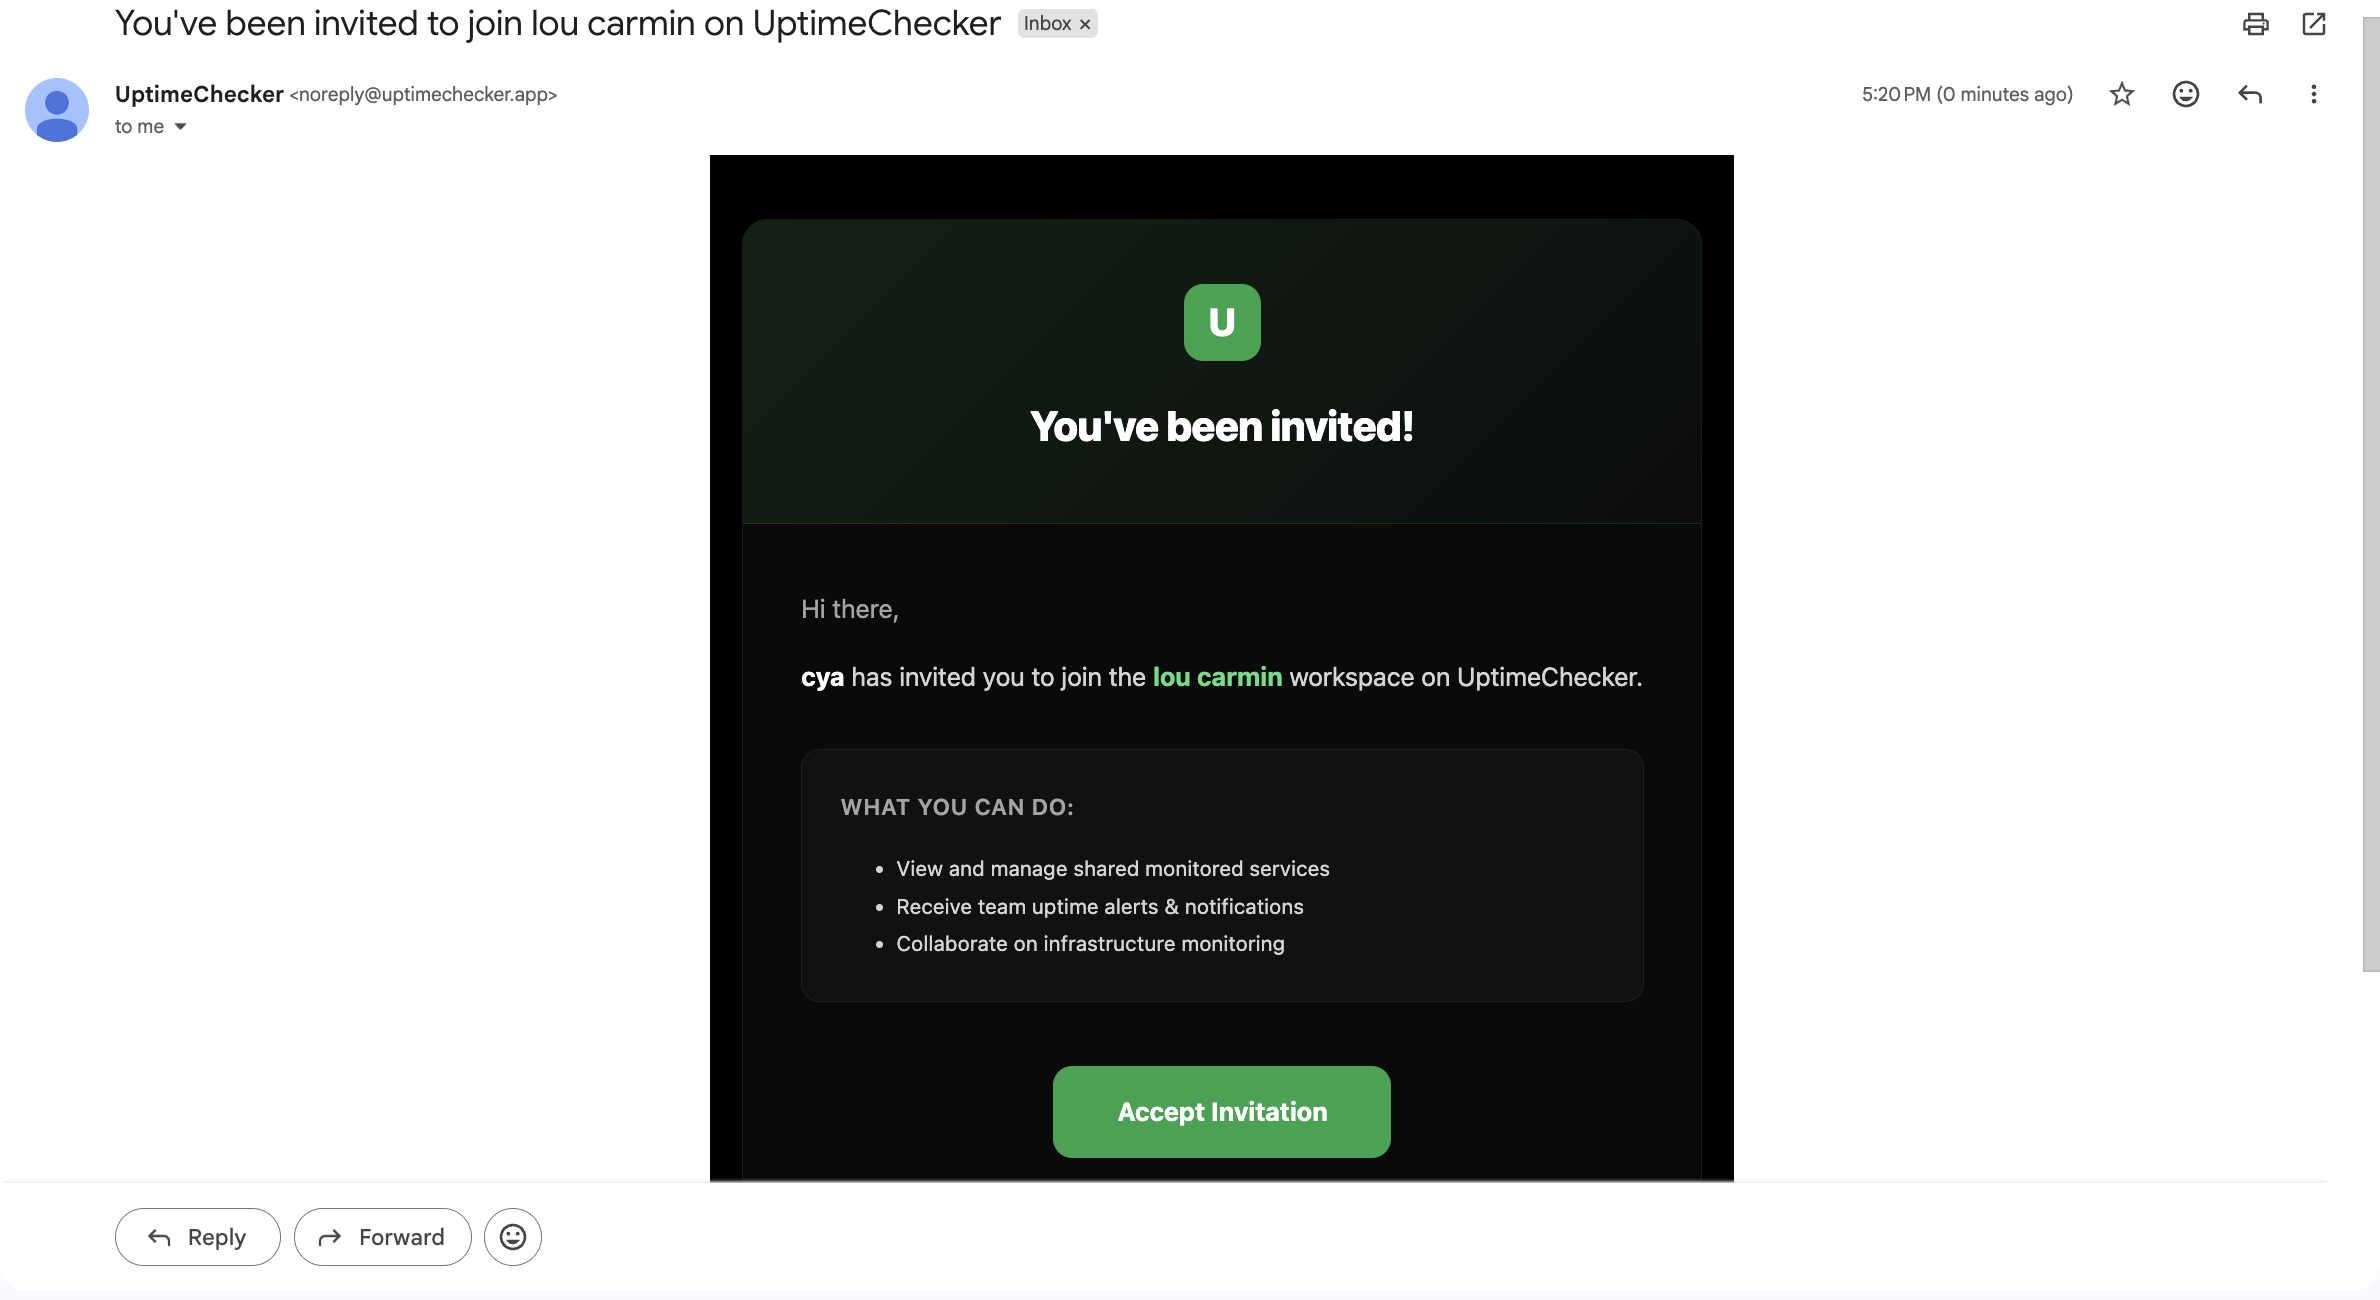
Email Invitations
When you invite a member, they receive a professional invitation email. They can join your team with a single click, ensuring a smooth onboarding experience for your entire organization.
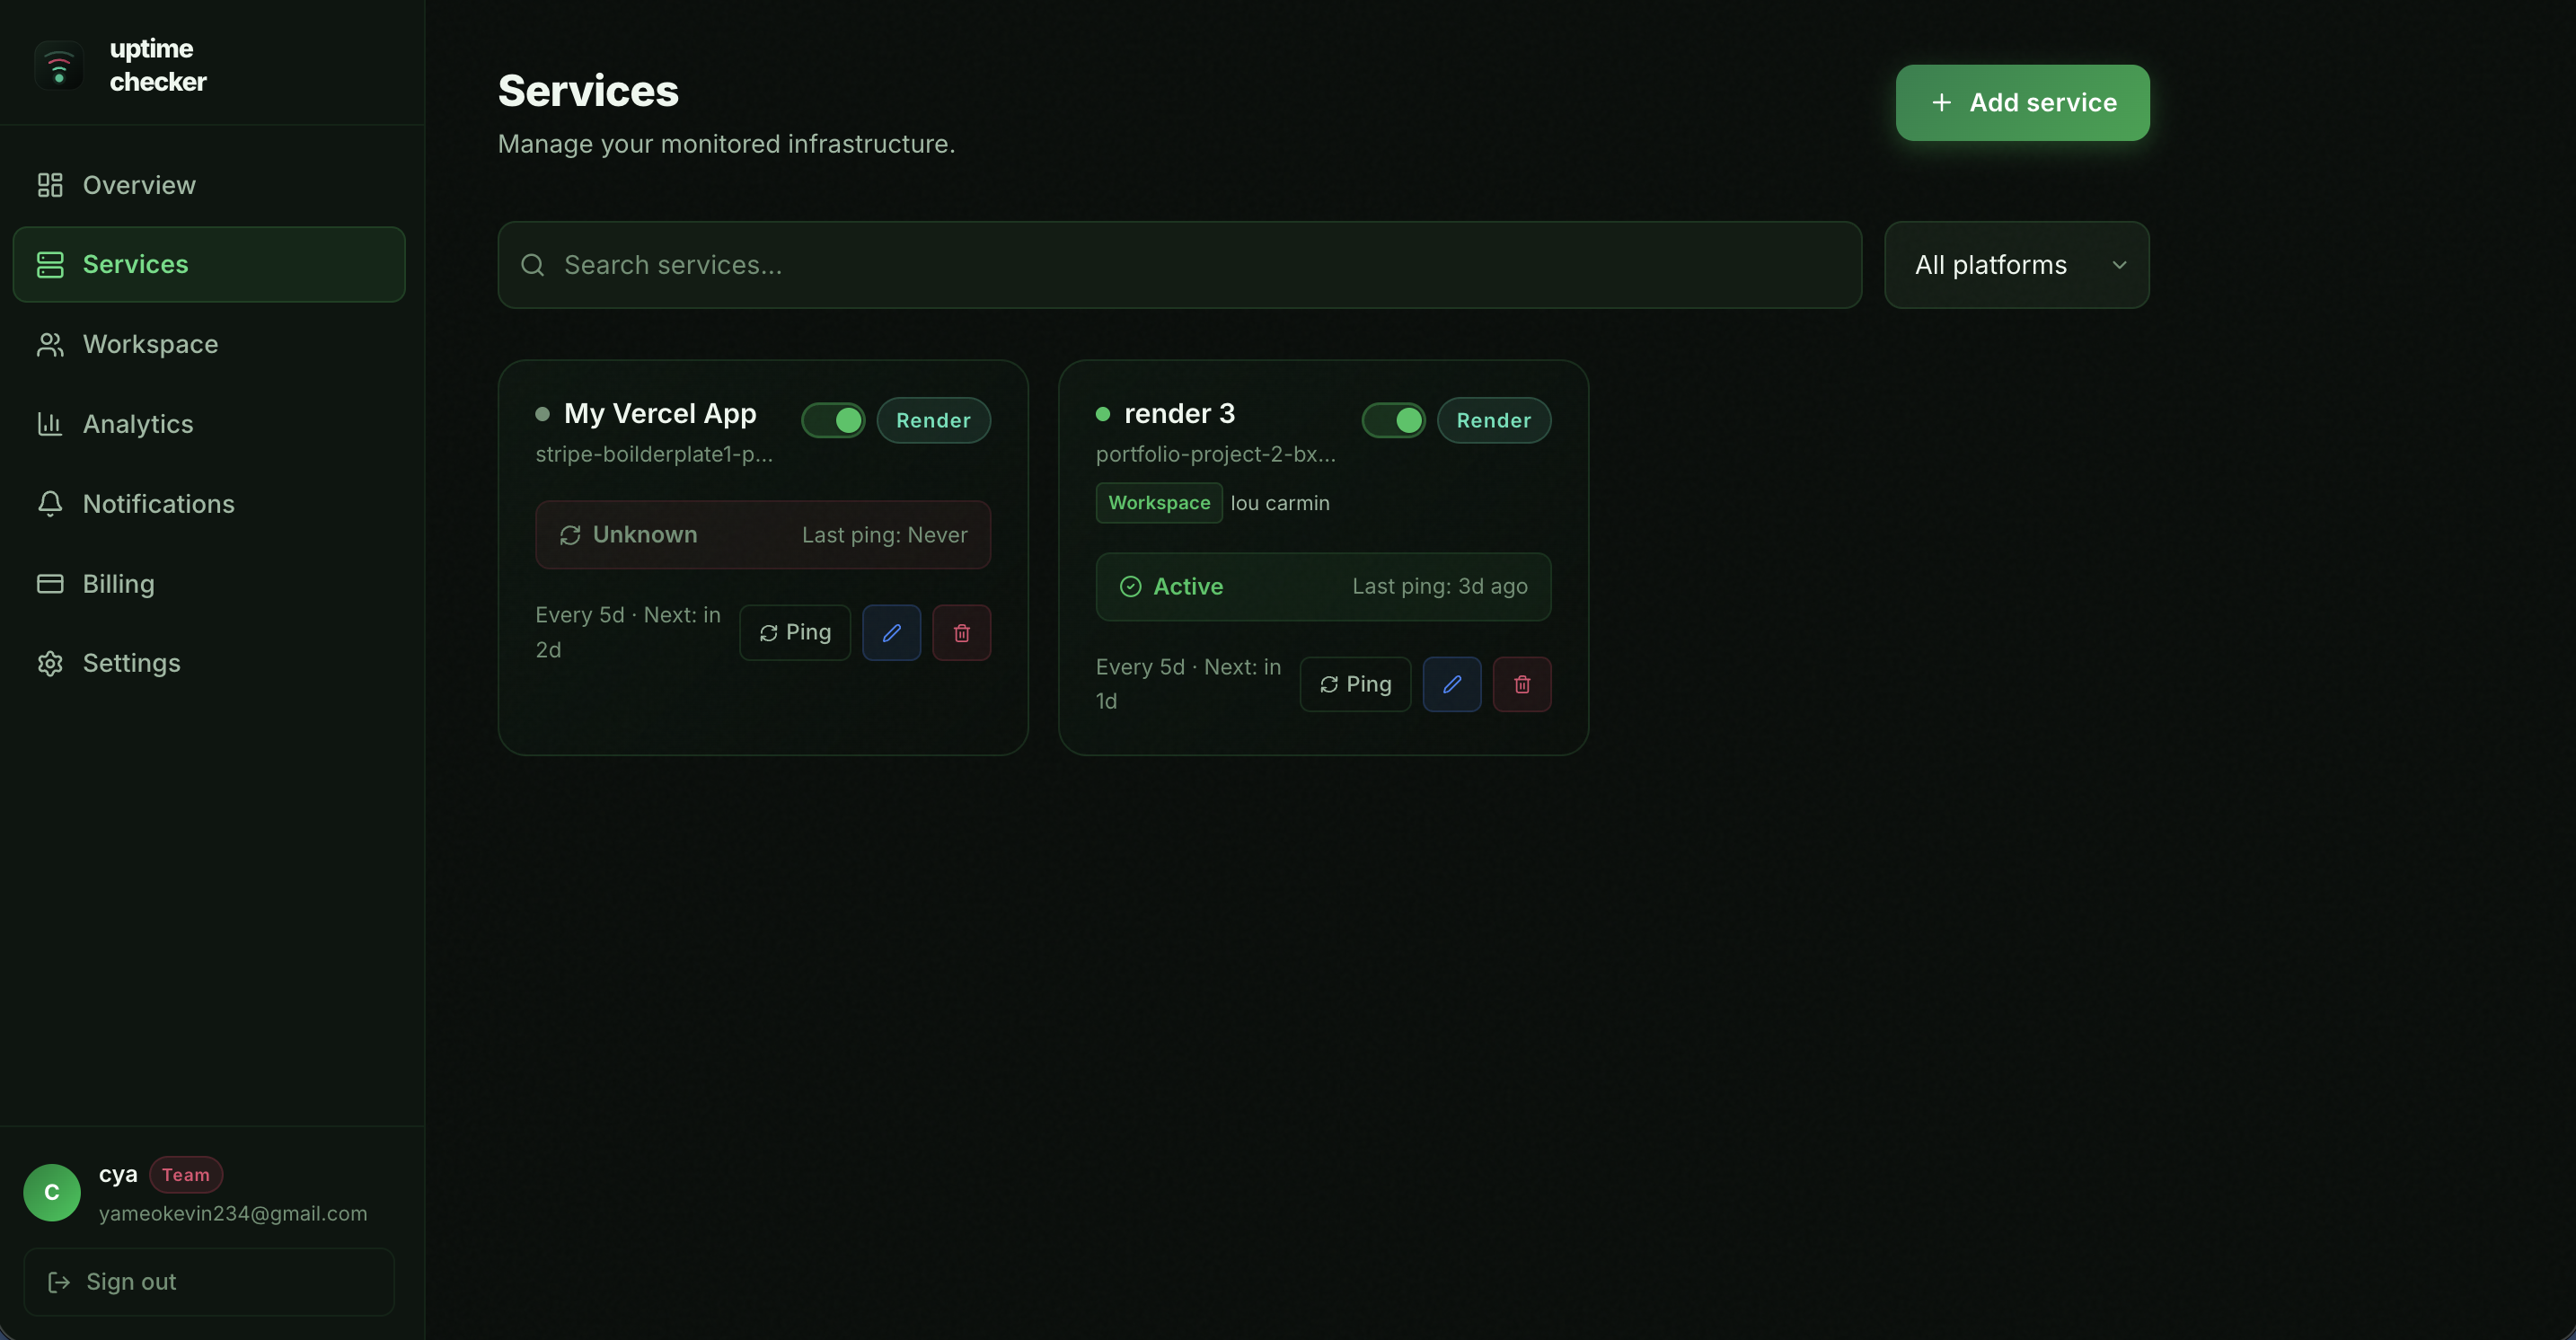
Sharing Services
You can move any service from your Personal account to a Workspace at any time. This allows your entire team to monitor the same infrastructure and receive shared notifications.
Audit Logs
Keep track of everything happening in your workspace. Audit logs provide a chronological history of critical actions, ensuring transparency and accountability for your team.
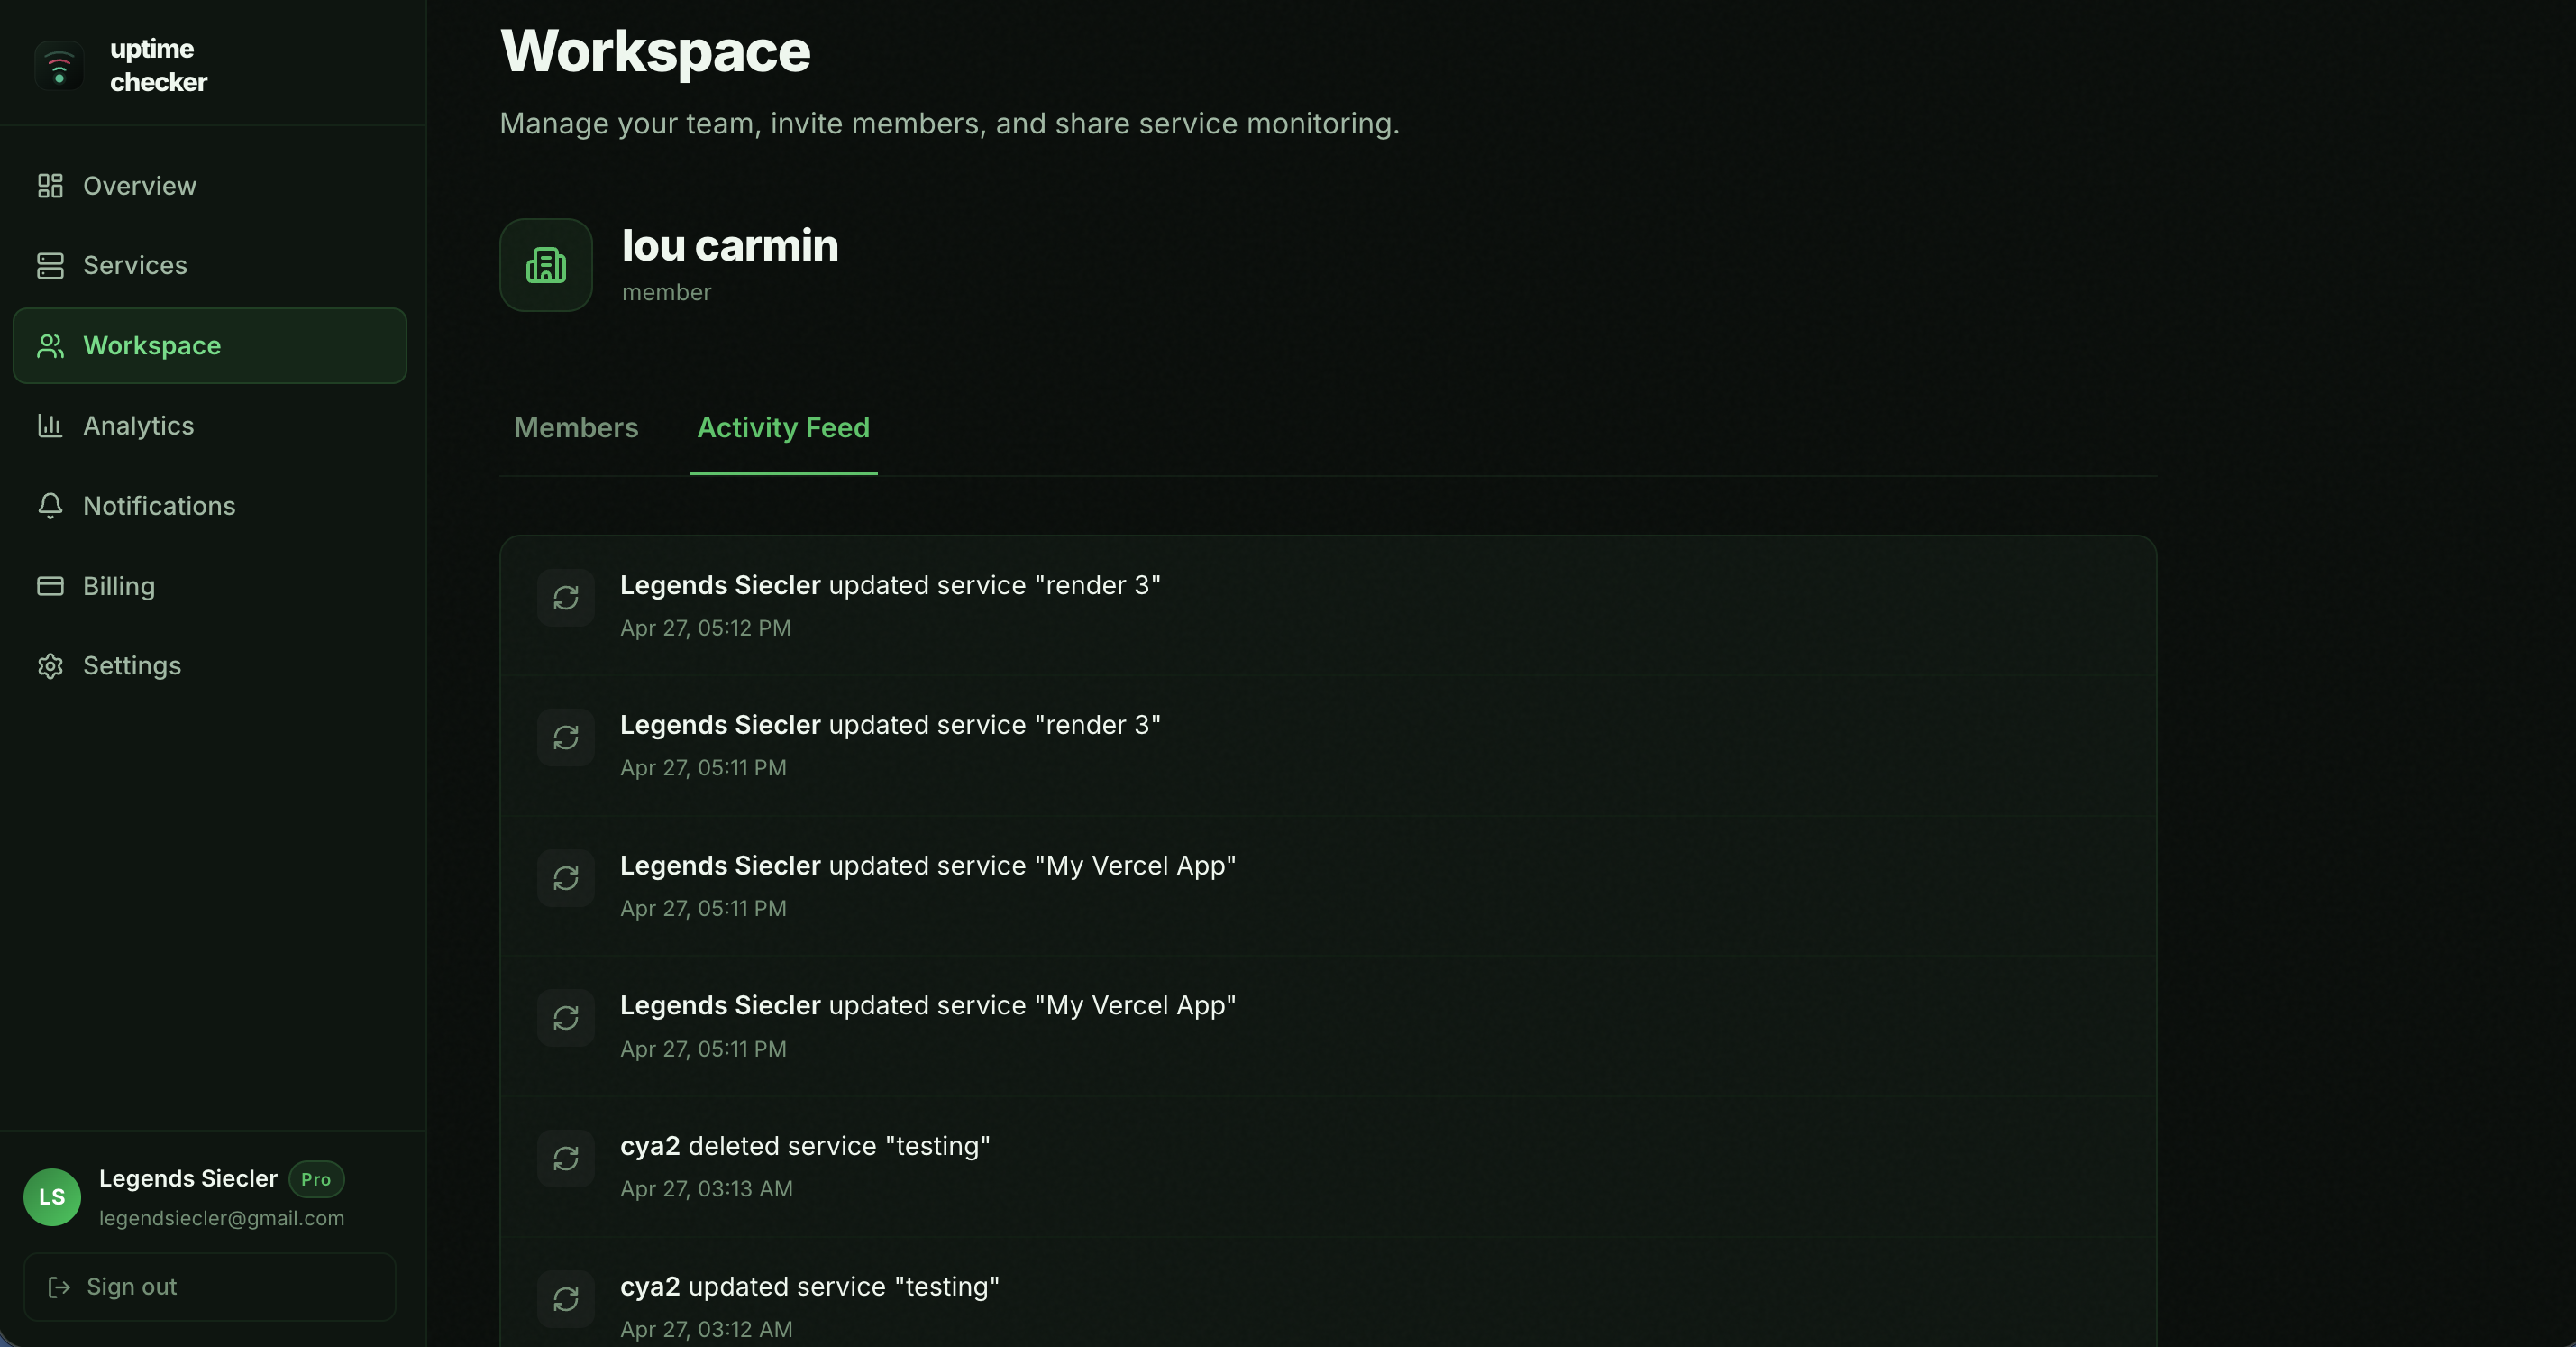
Member Activity
Track when members join, are invited, or have their roles changed.
Service Changes
Log when services are created, updated, paused, or deleted.
Workspace Management
Record high-level changes to workspace names or settings.
Analytics
Track the reliability of your infrastructure over time. Monitor uptime trends, average response times, and identify issues before they affect your users.
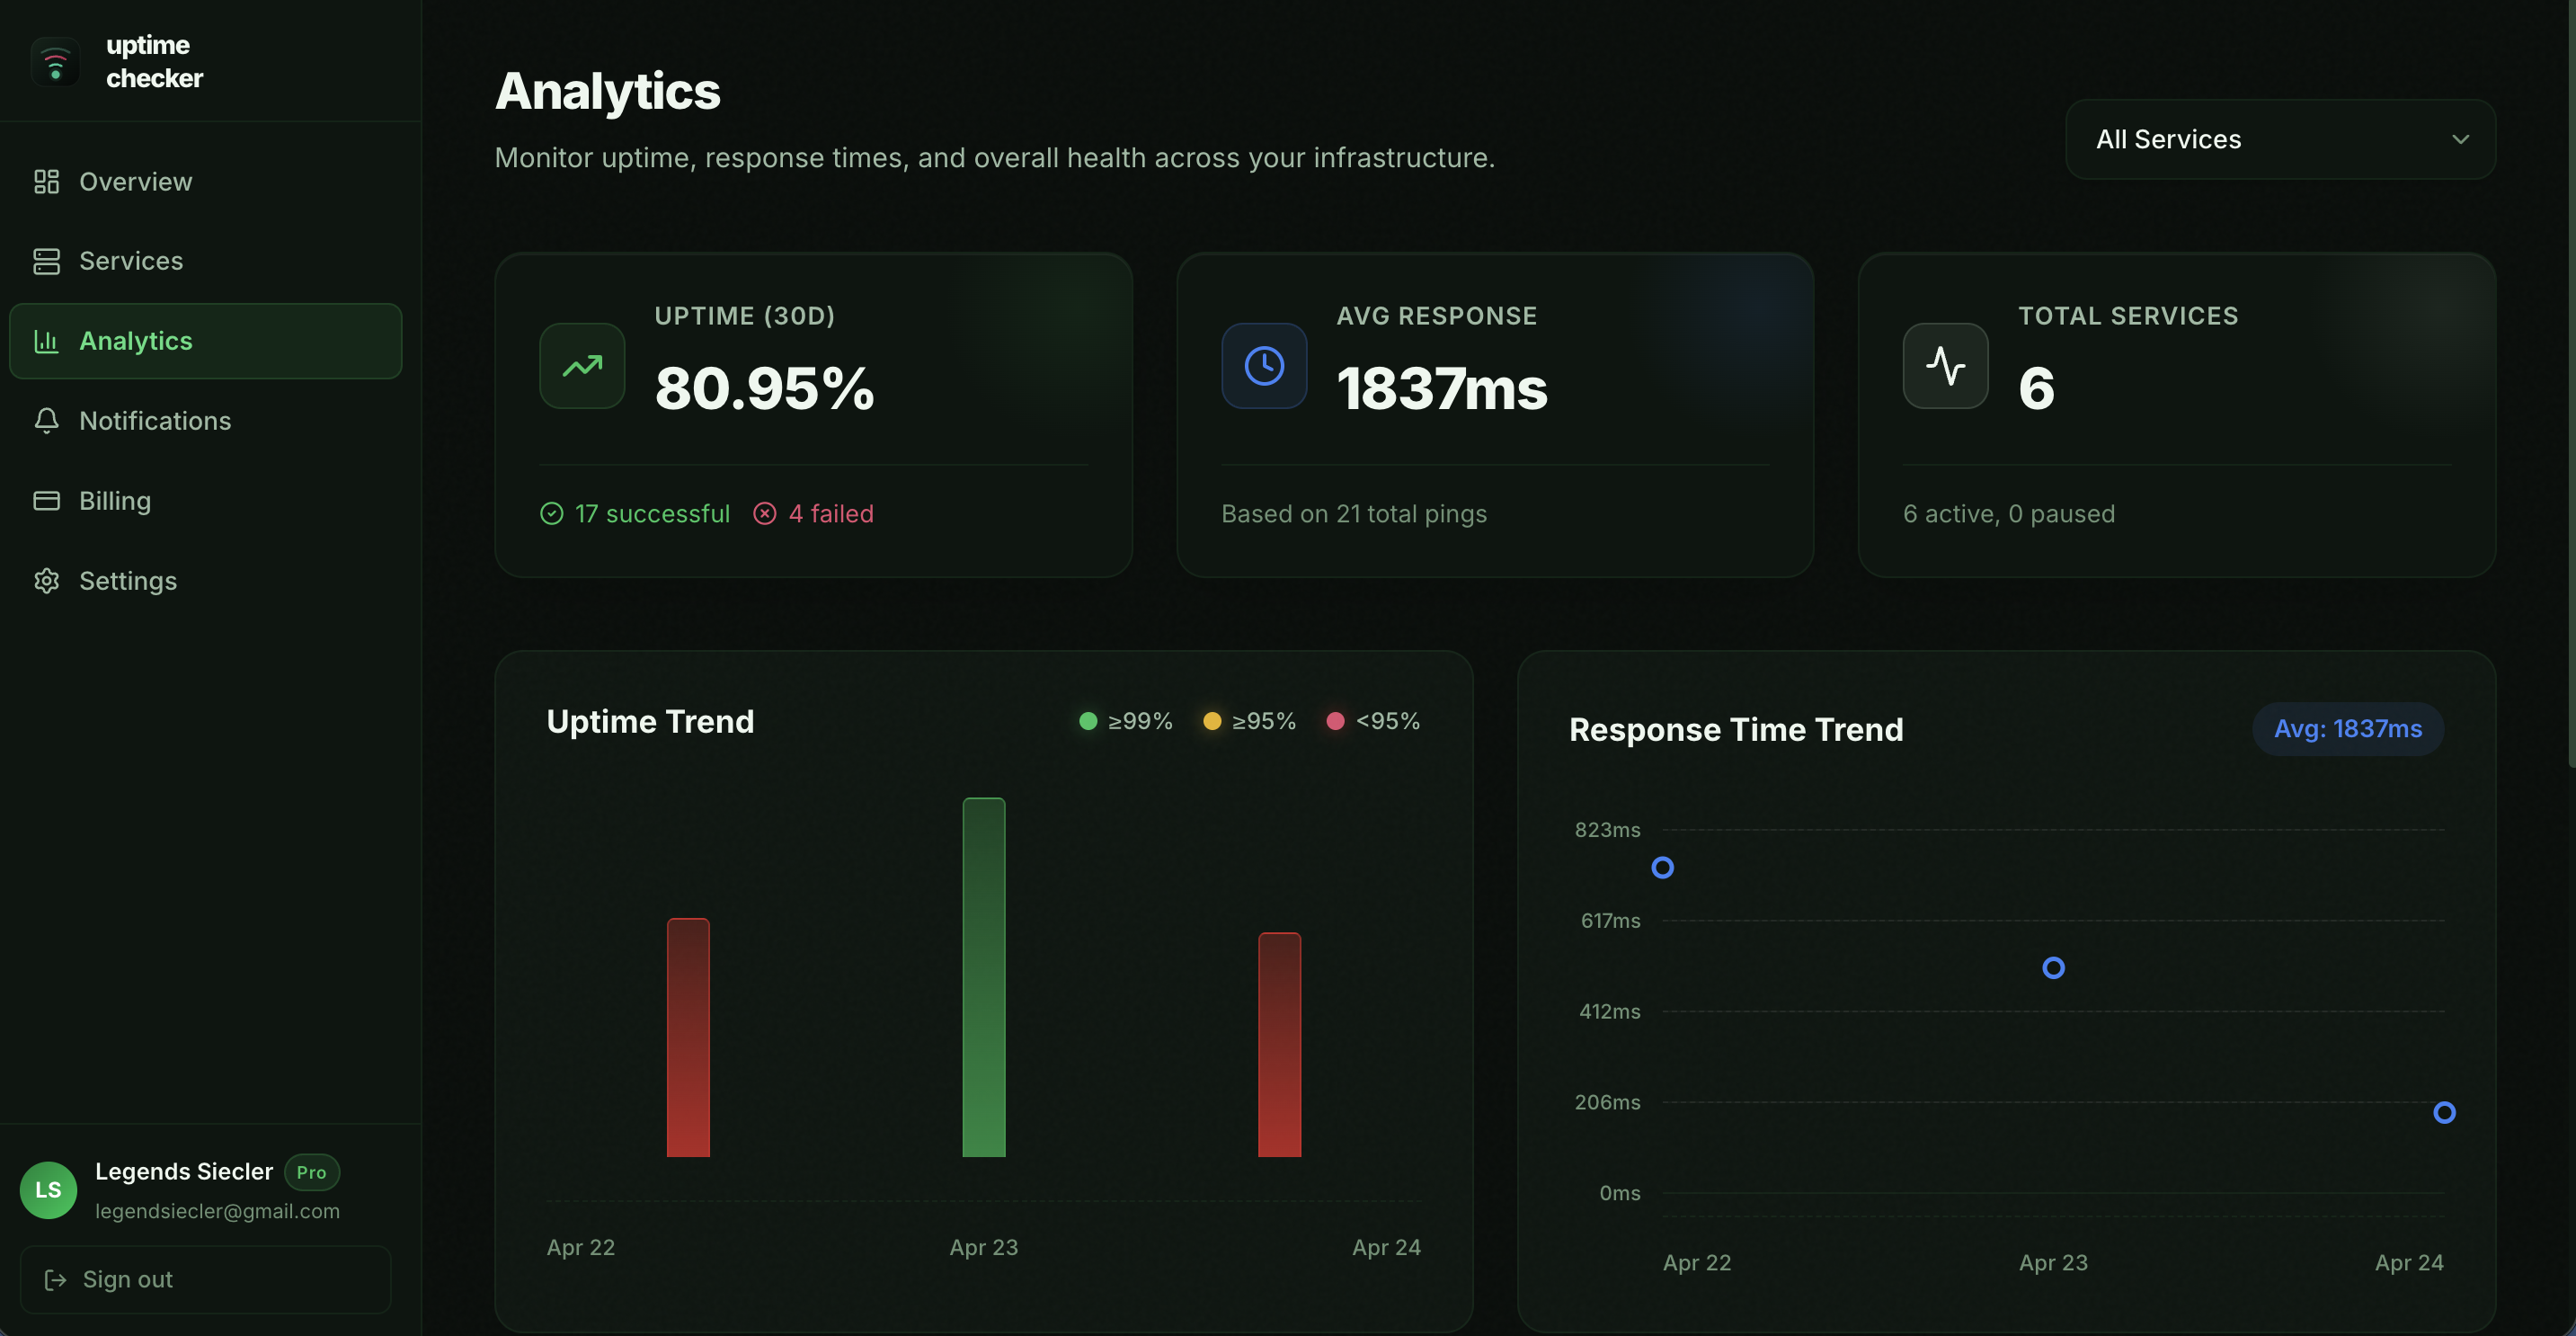
Uptime Trends
Our color-coded bar chart helps you instantly spot any days where your services experienced downtime or instability.
Response Times
Track latency across your infrastructure to ensure your endpoints aren't just awake, but performing optimally.
Notifications
Stay informed the moment a service goes down or recovers. Configure multiple channels to ensure you never miss a critical alert.
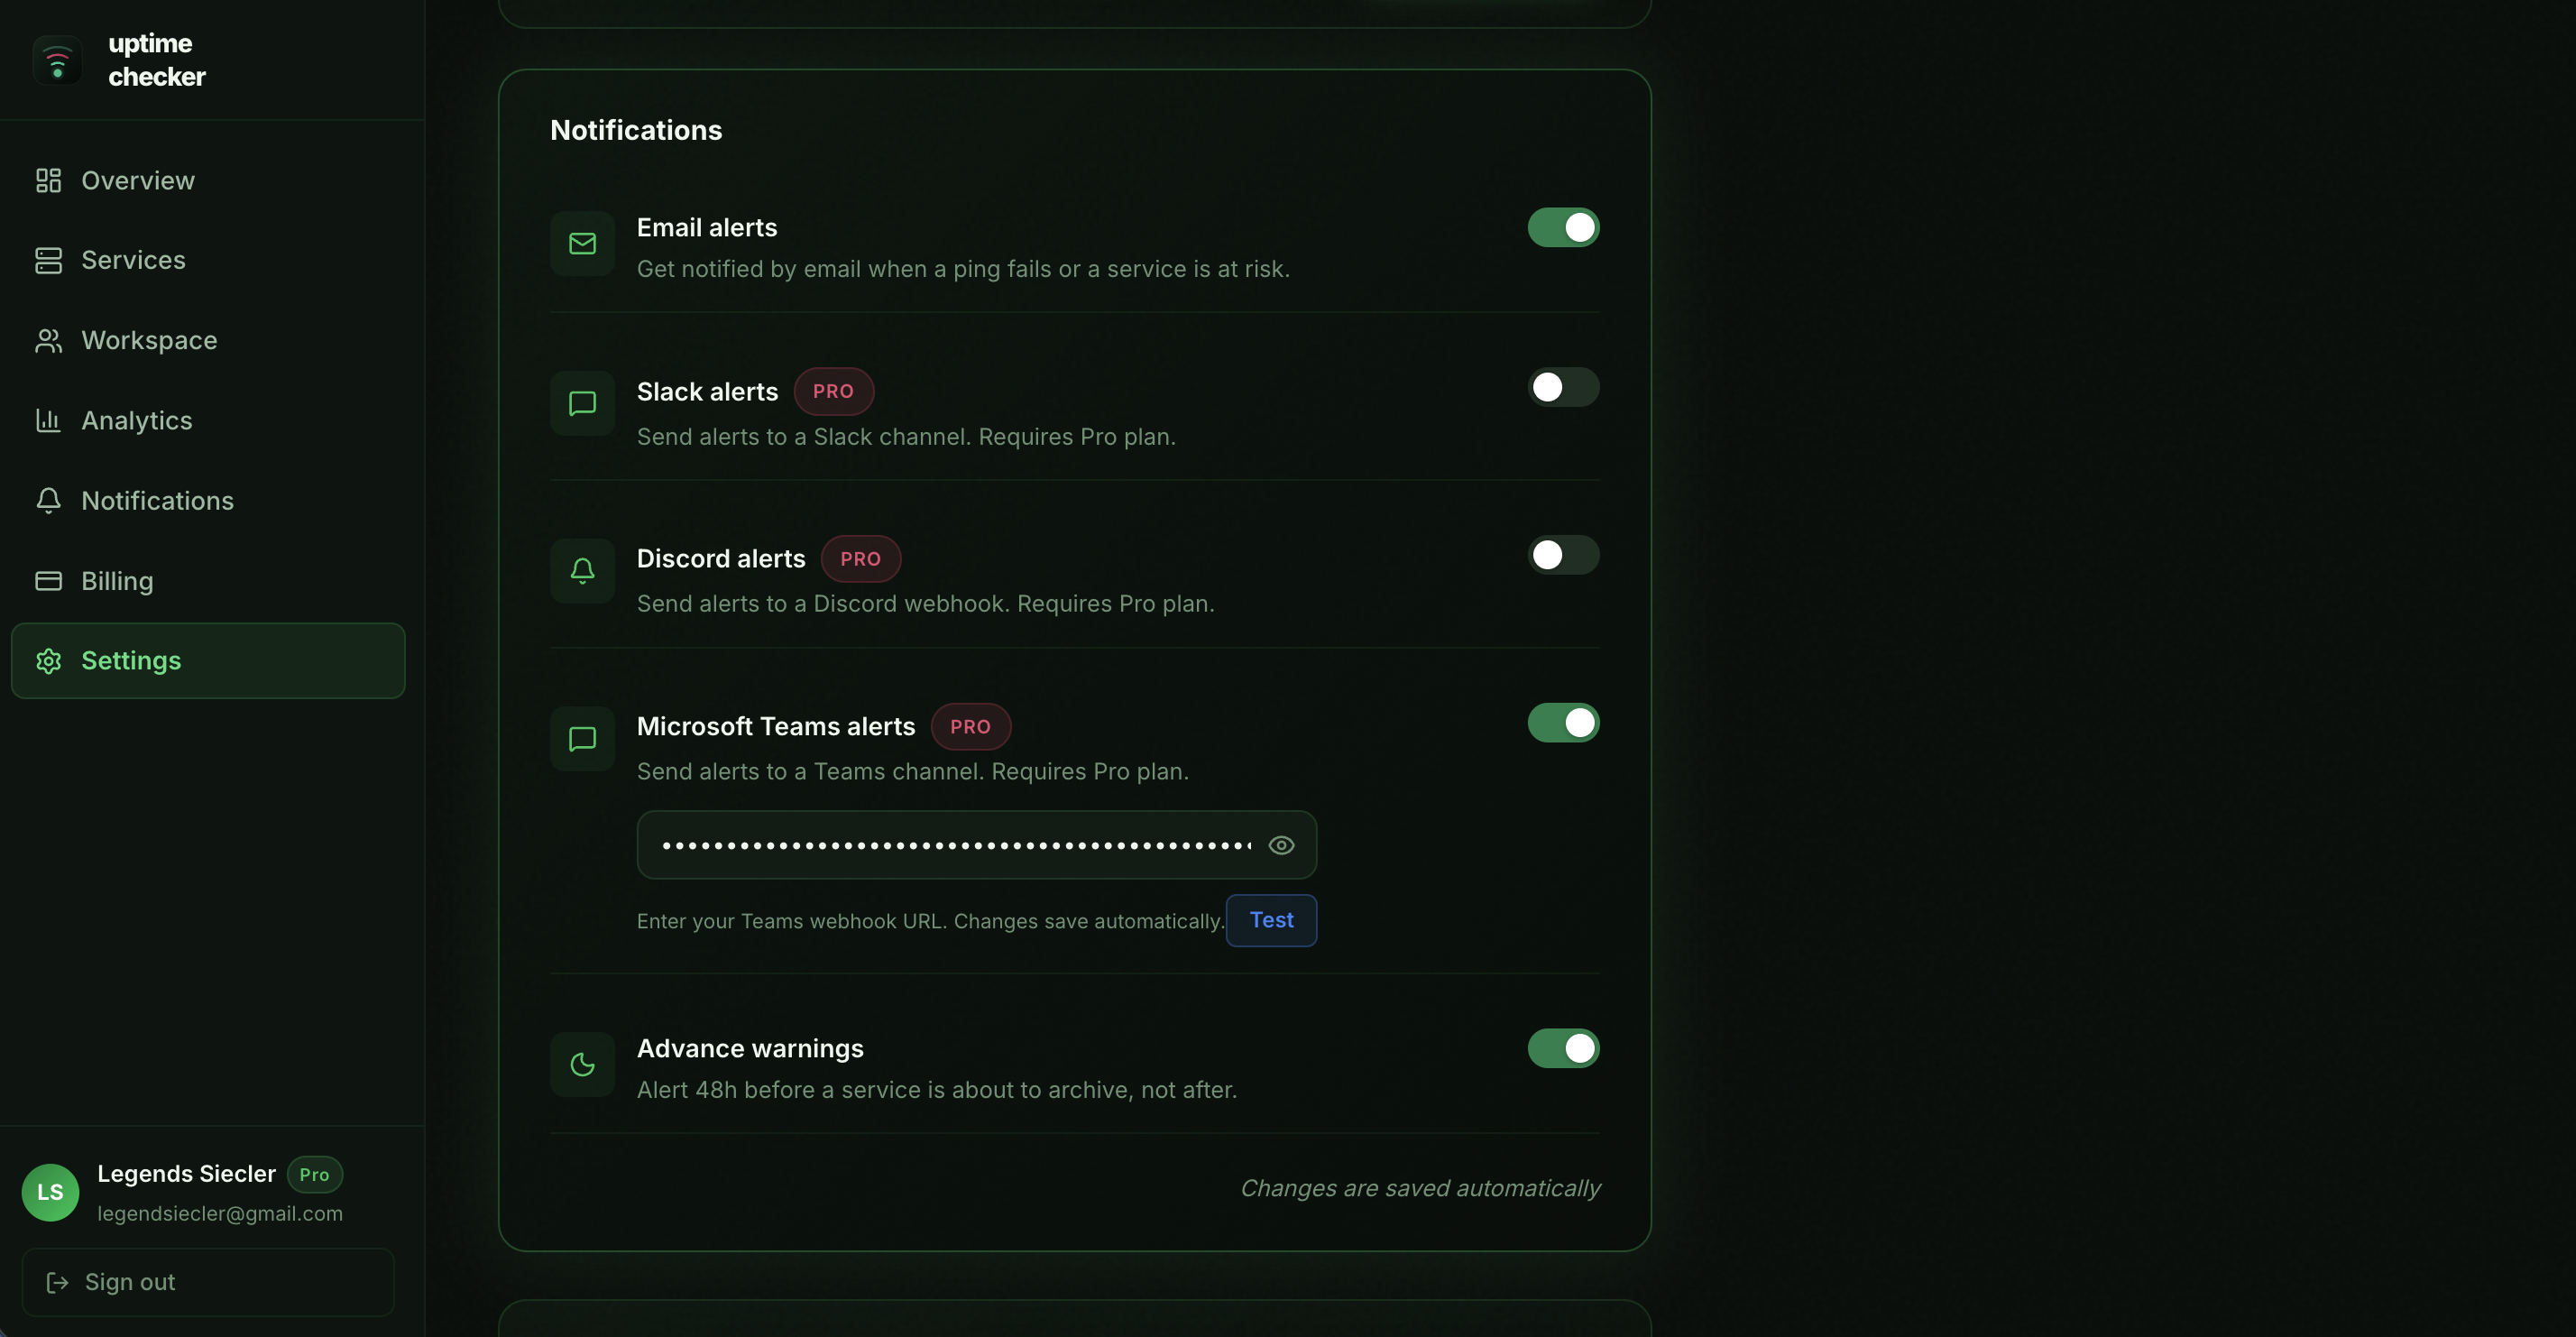
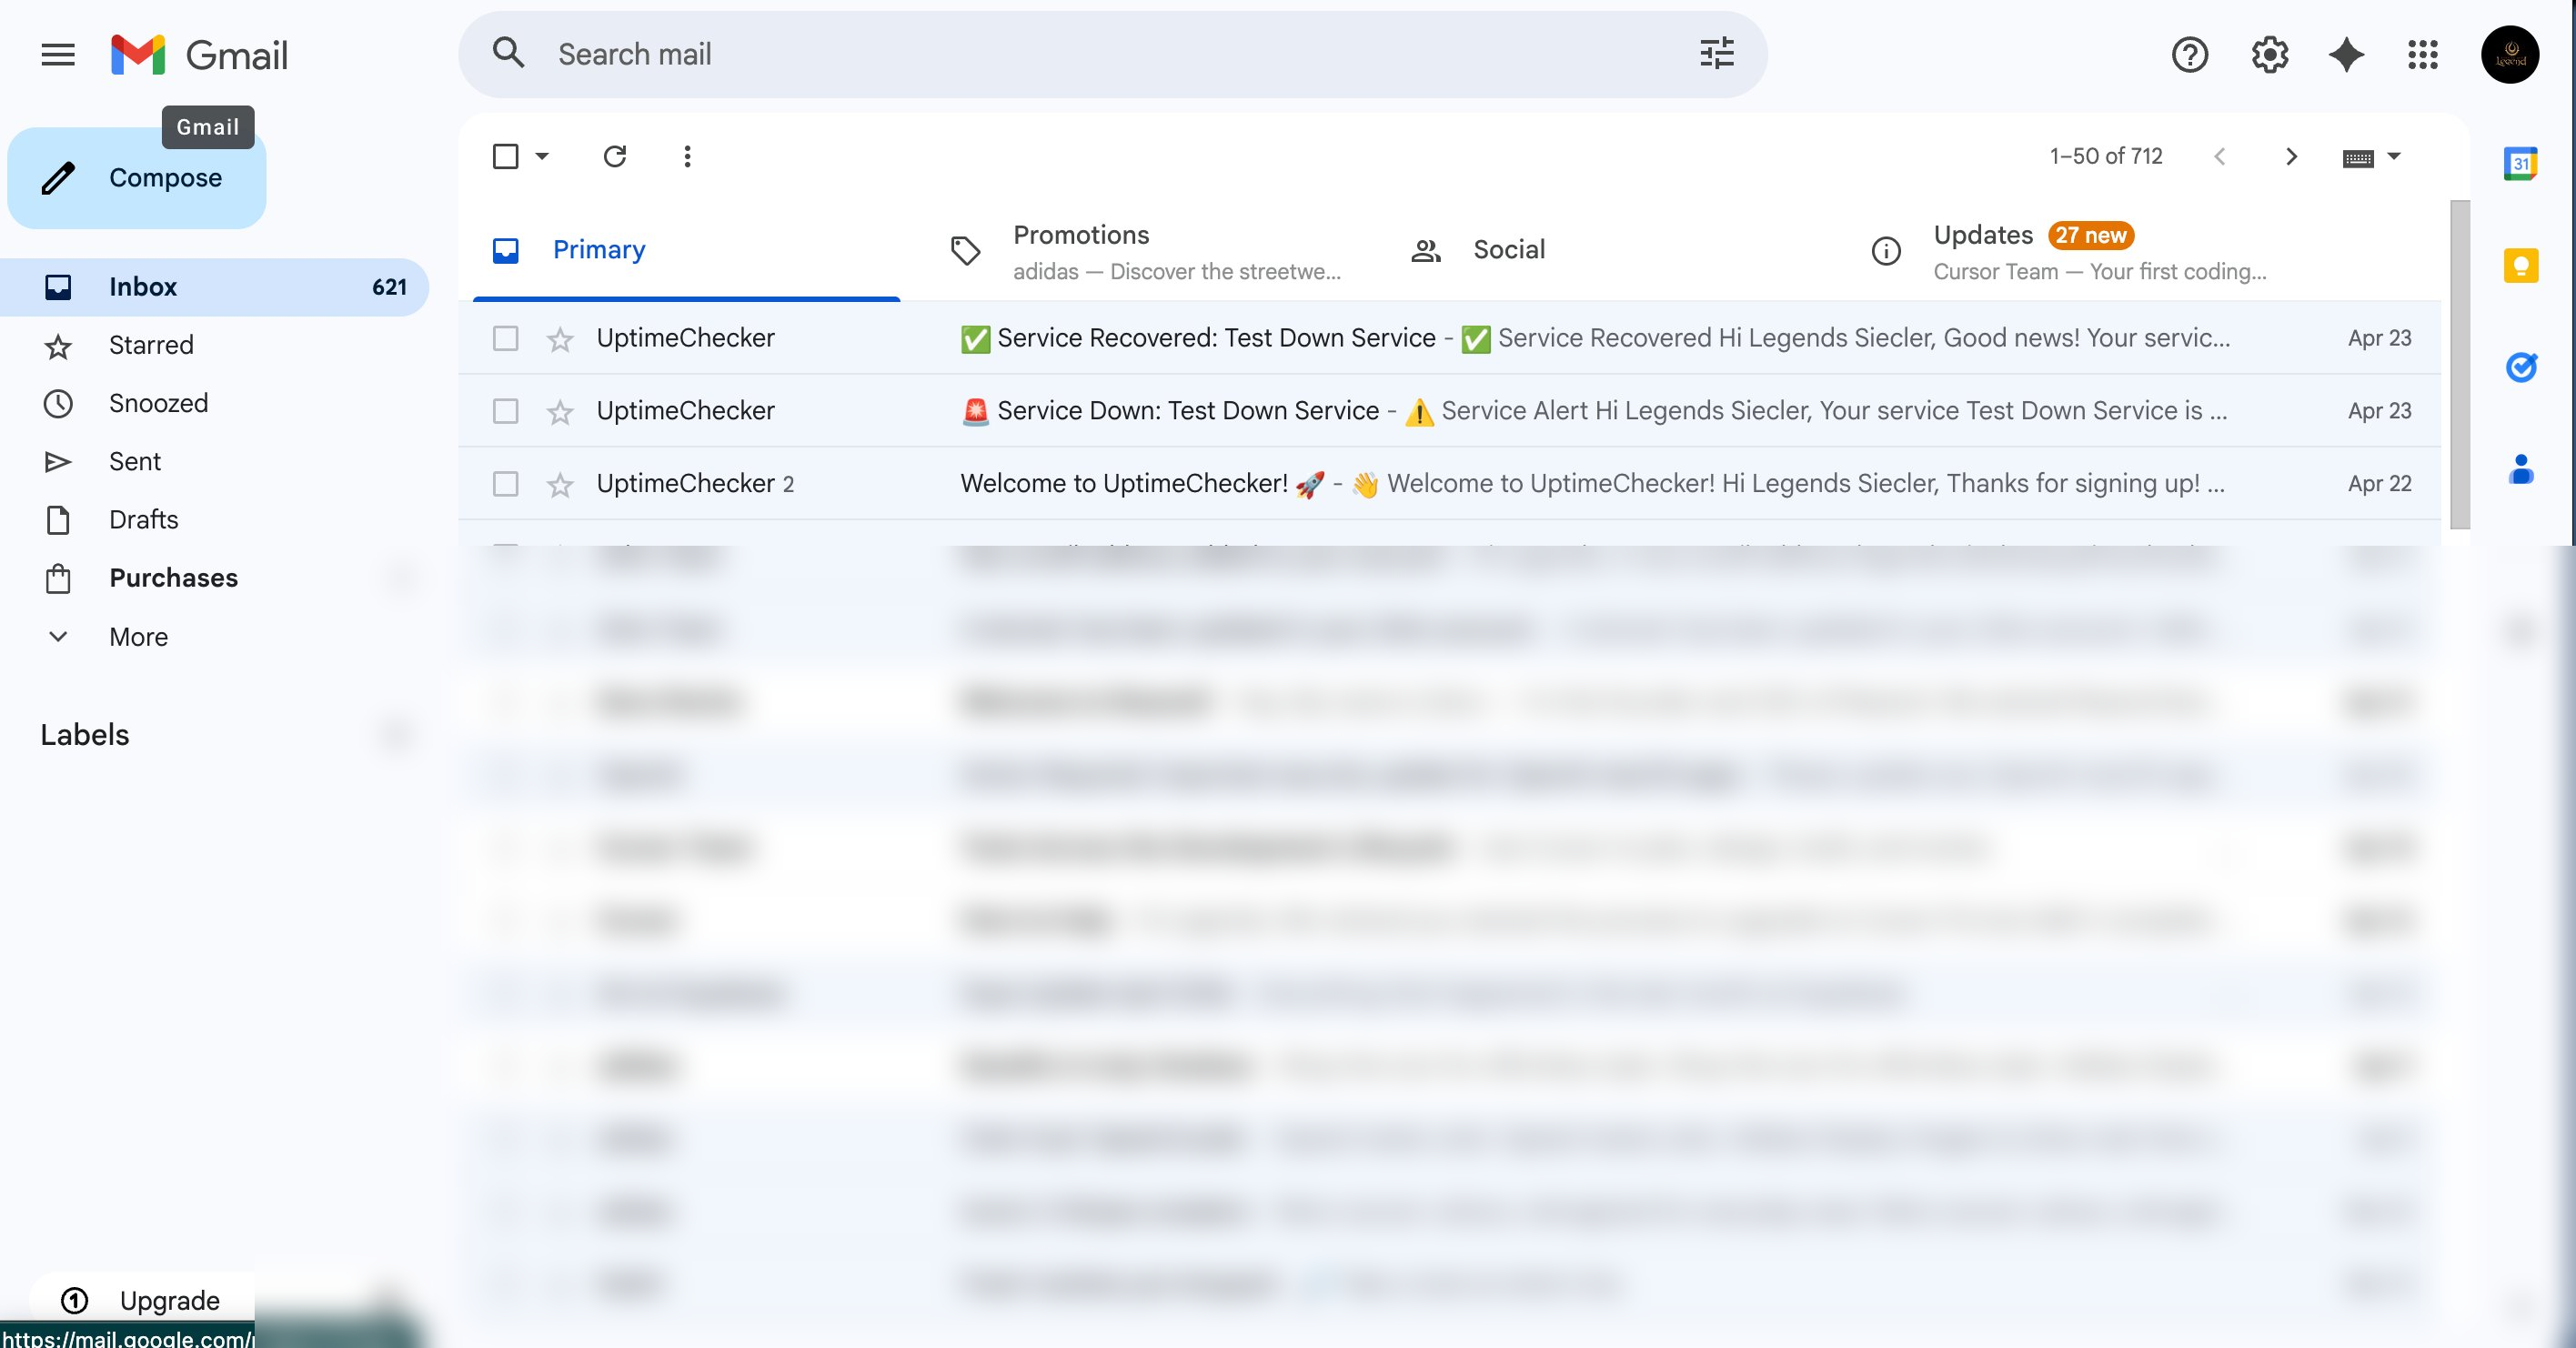
Email Alerts
Directly to your registered inbox. Reliable and always enabled by default for crucial downtime notifications.
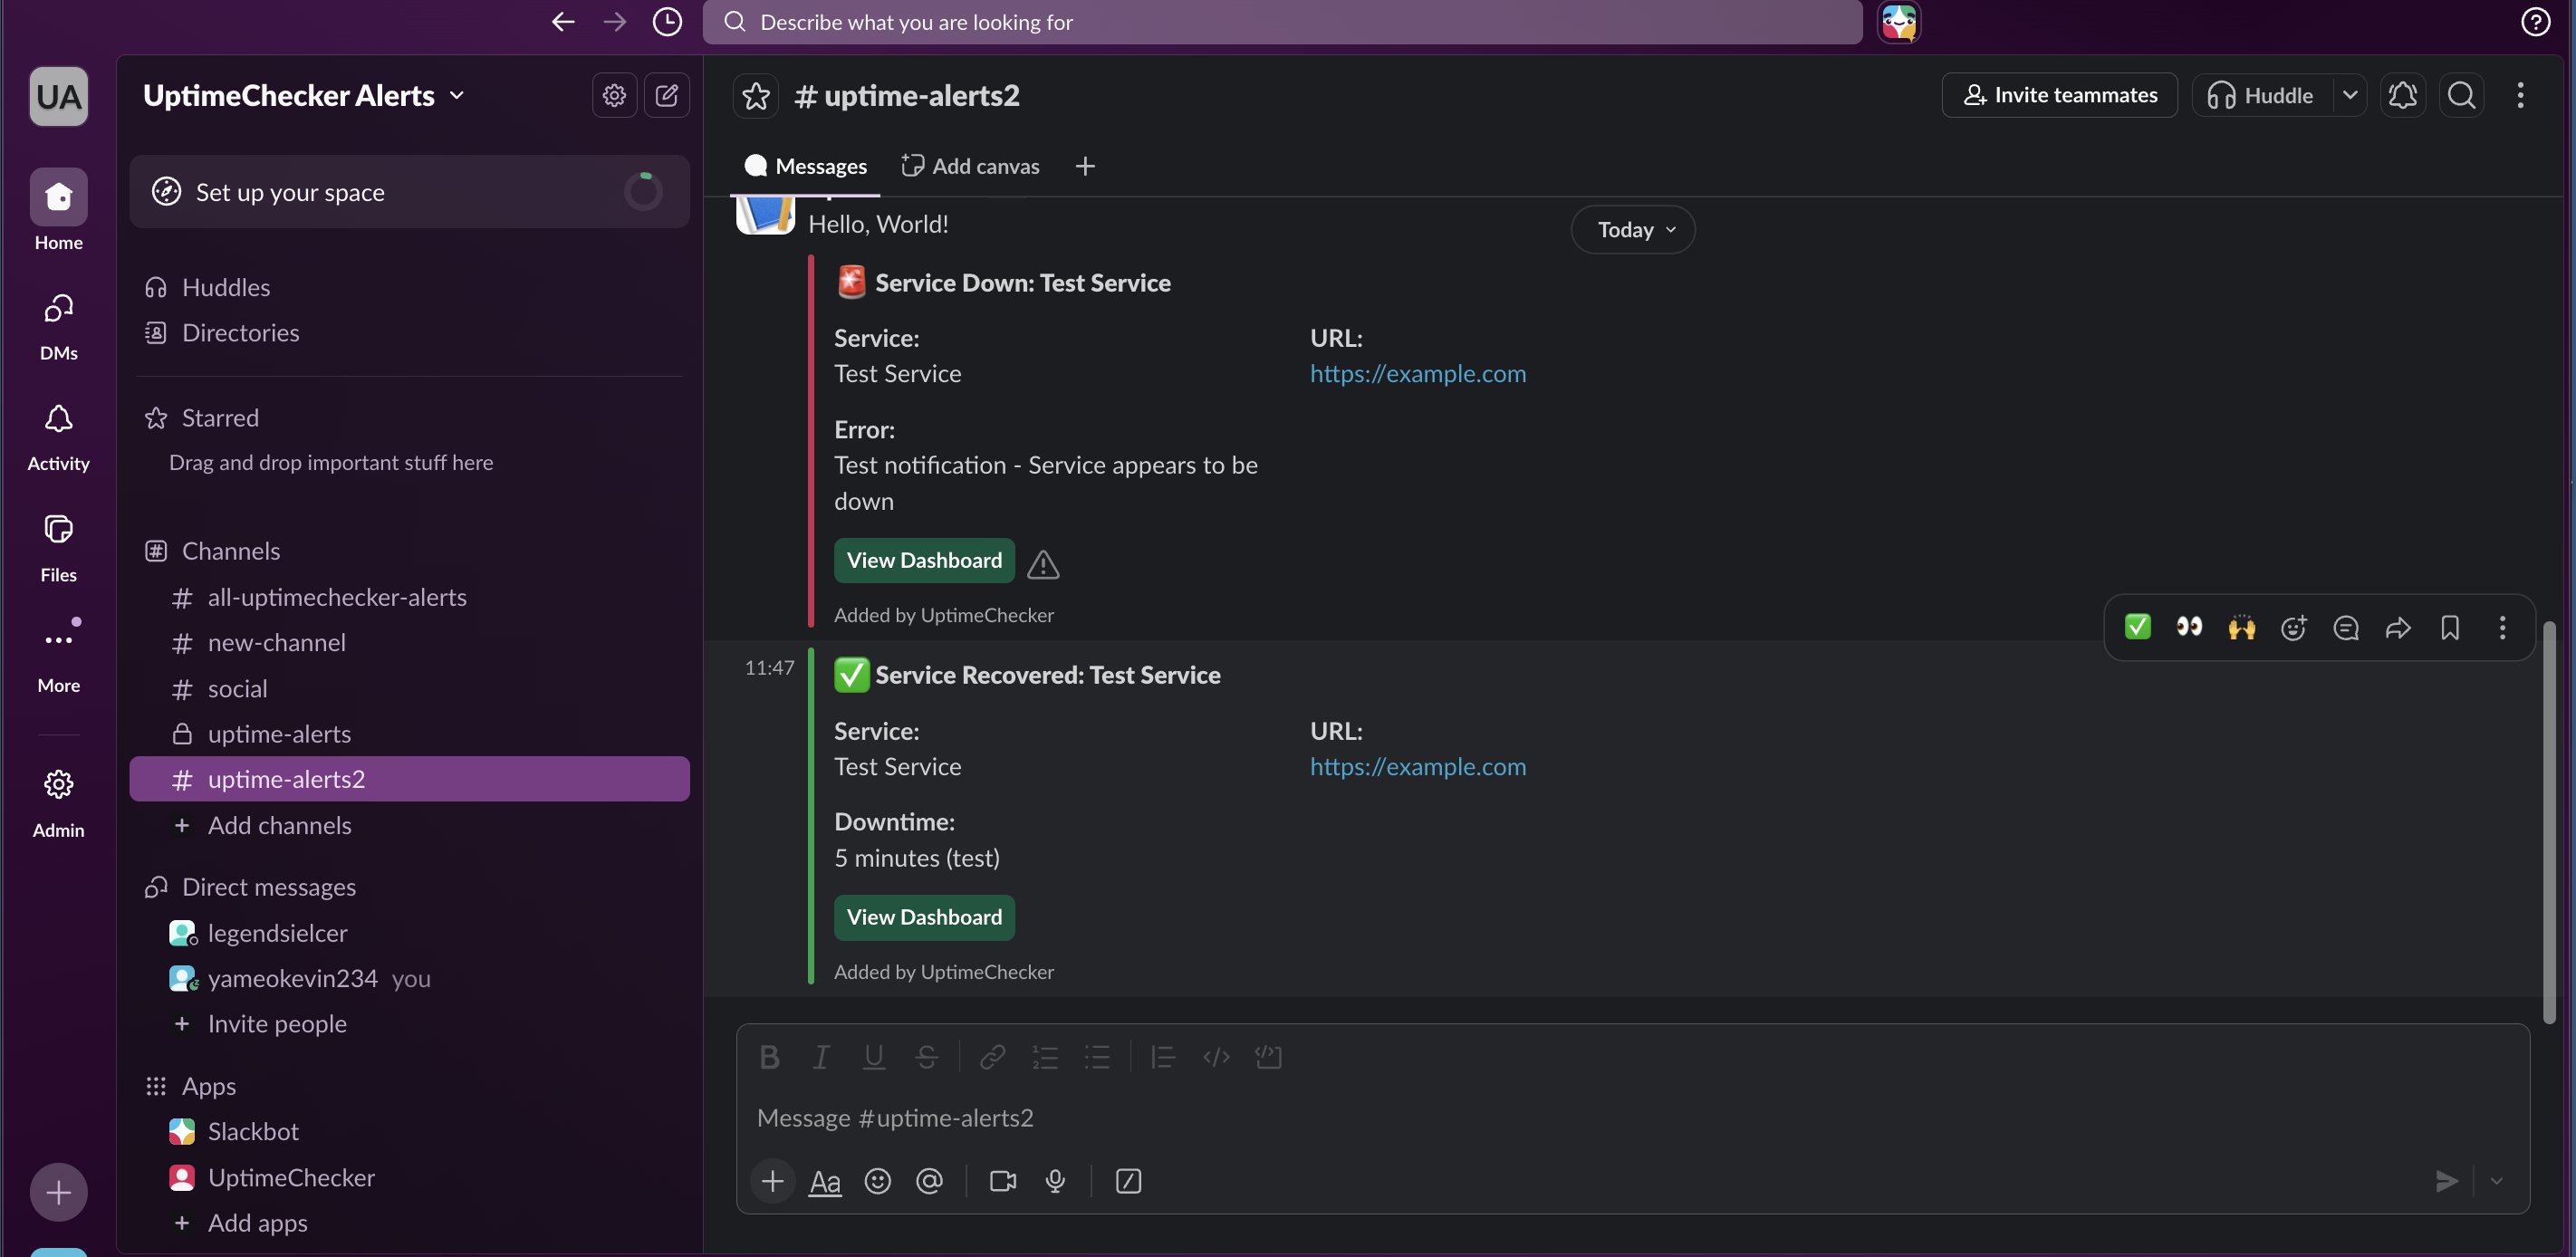
Slack Webhooks
Connect an incoming webhook to get instant alerts directly in your team's Slack channels.
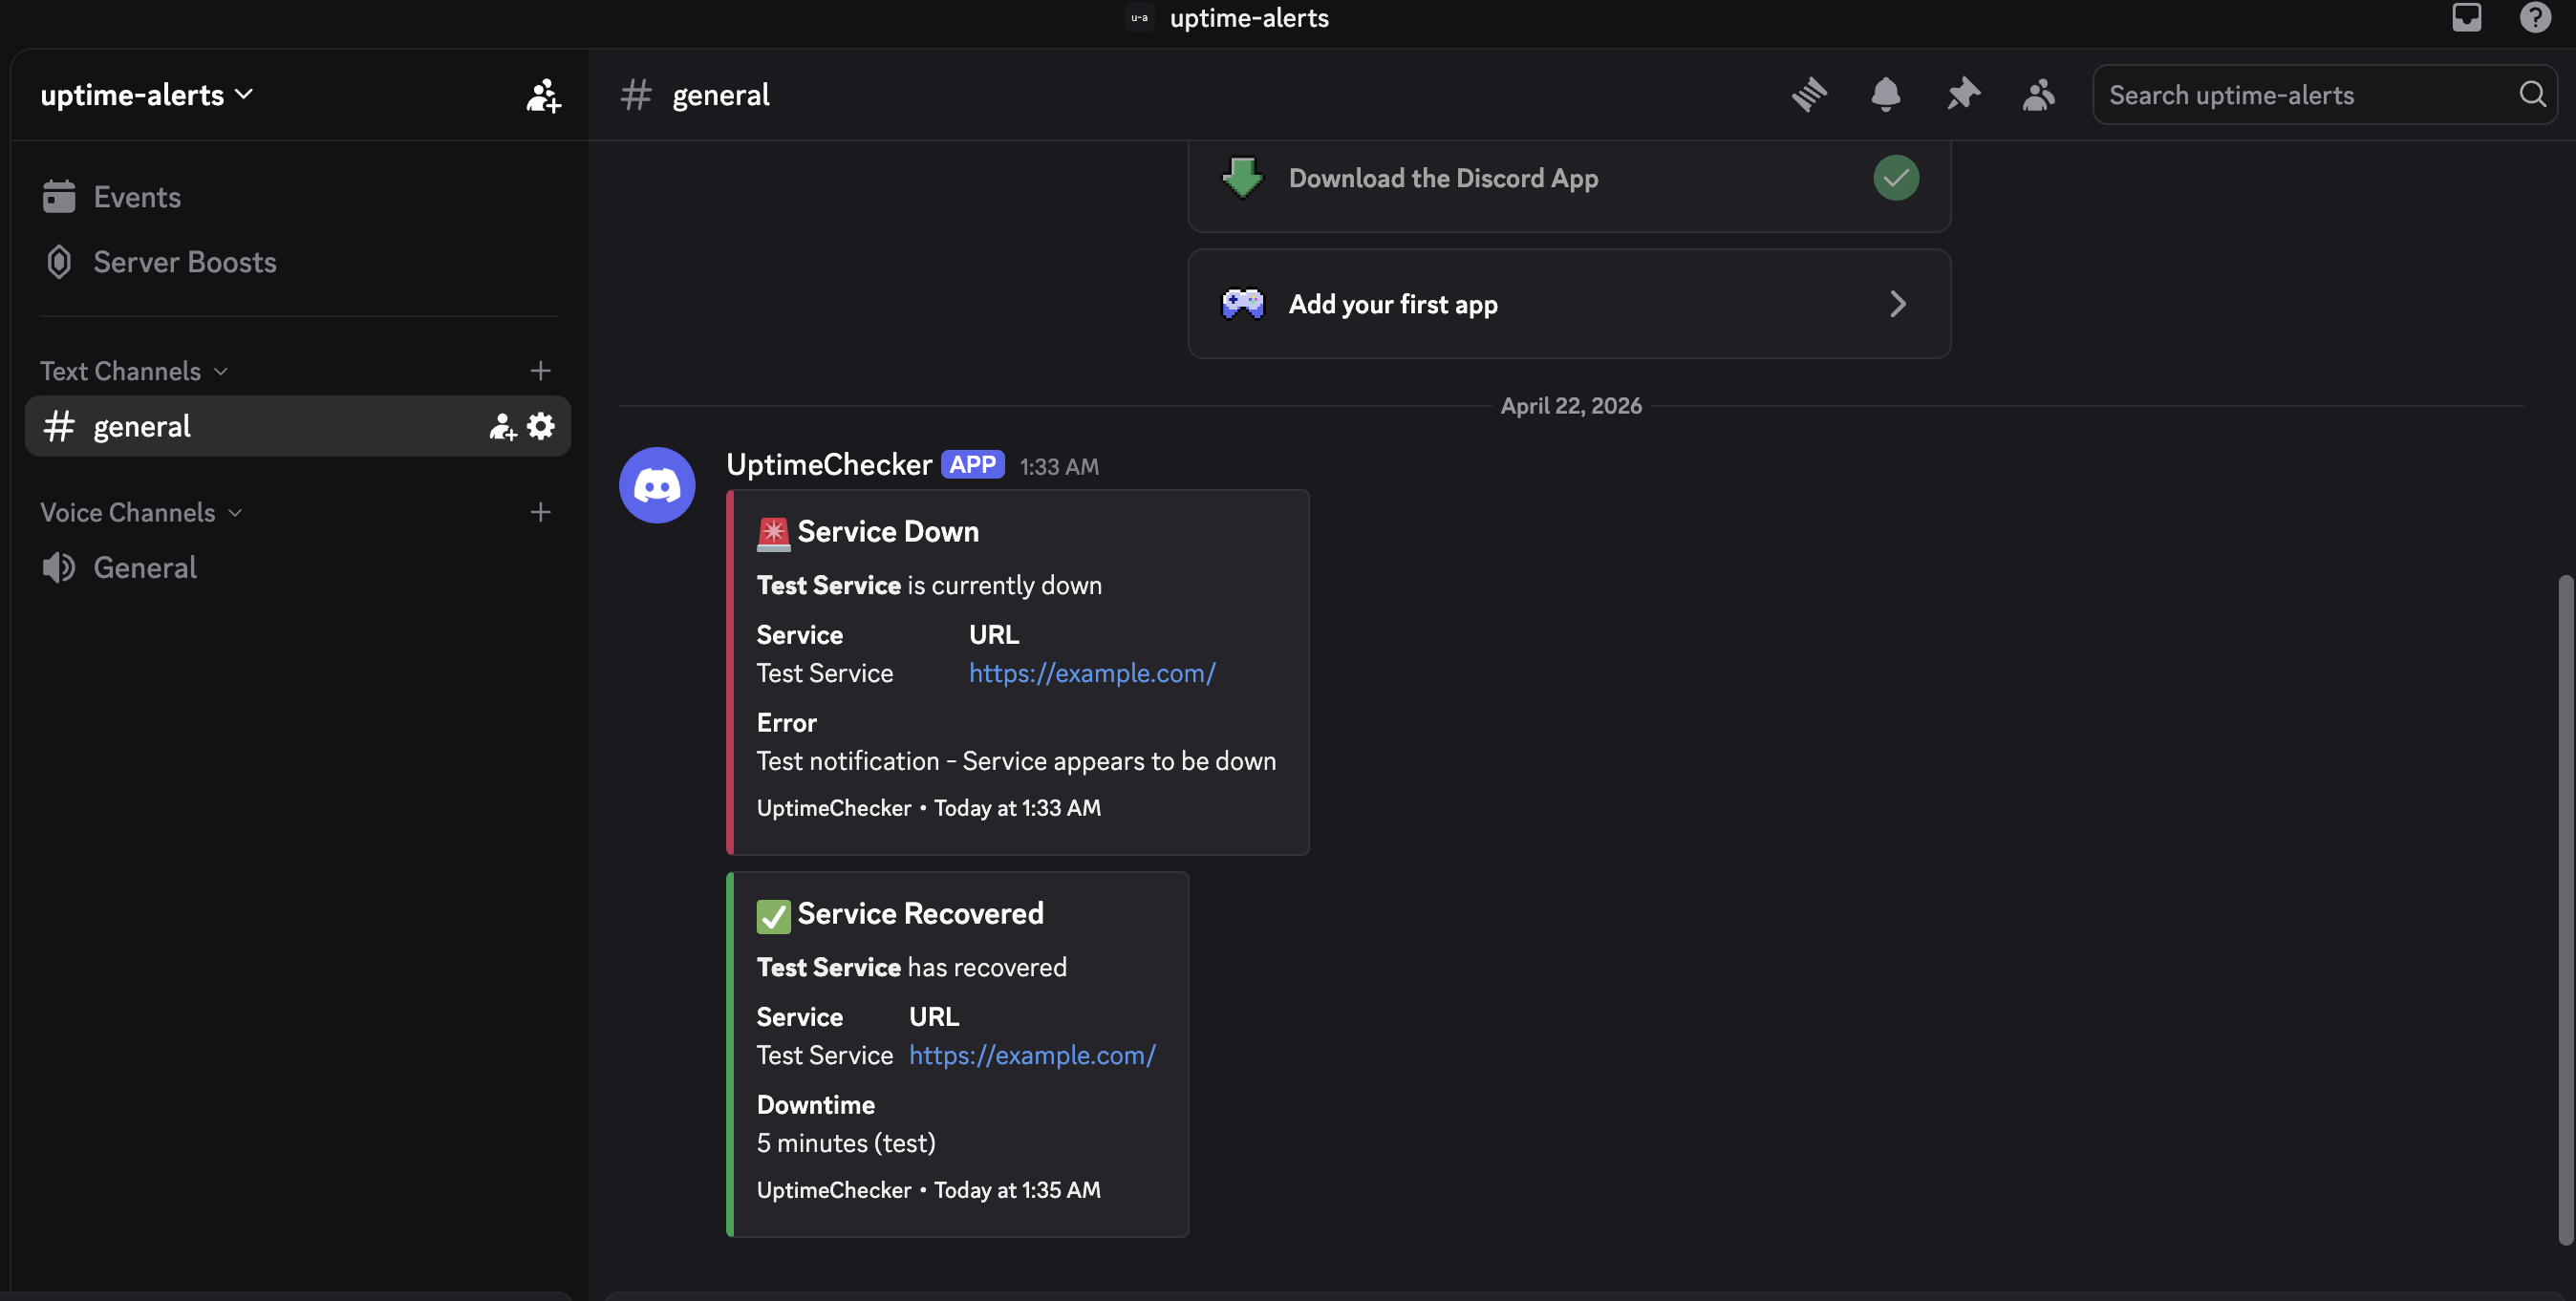
Discord Integration
Pipe status updates straight into your Discord server using native webhook integration.
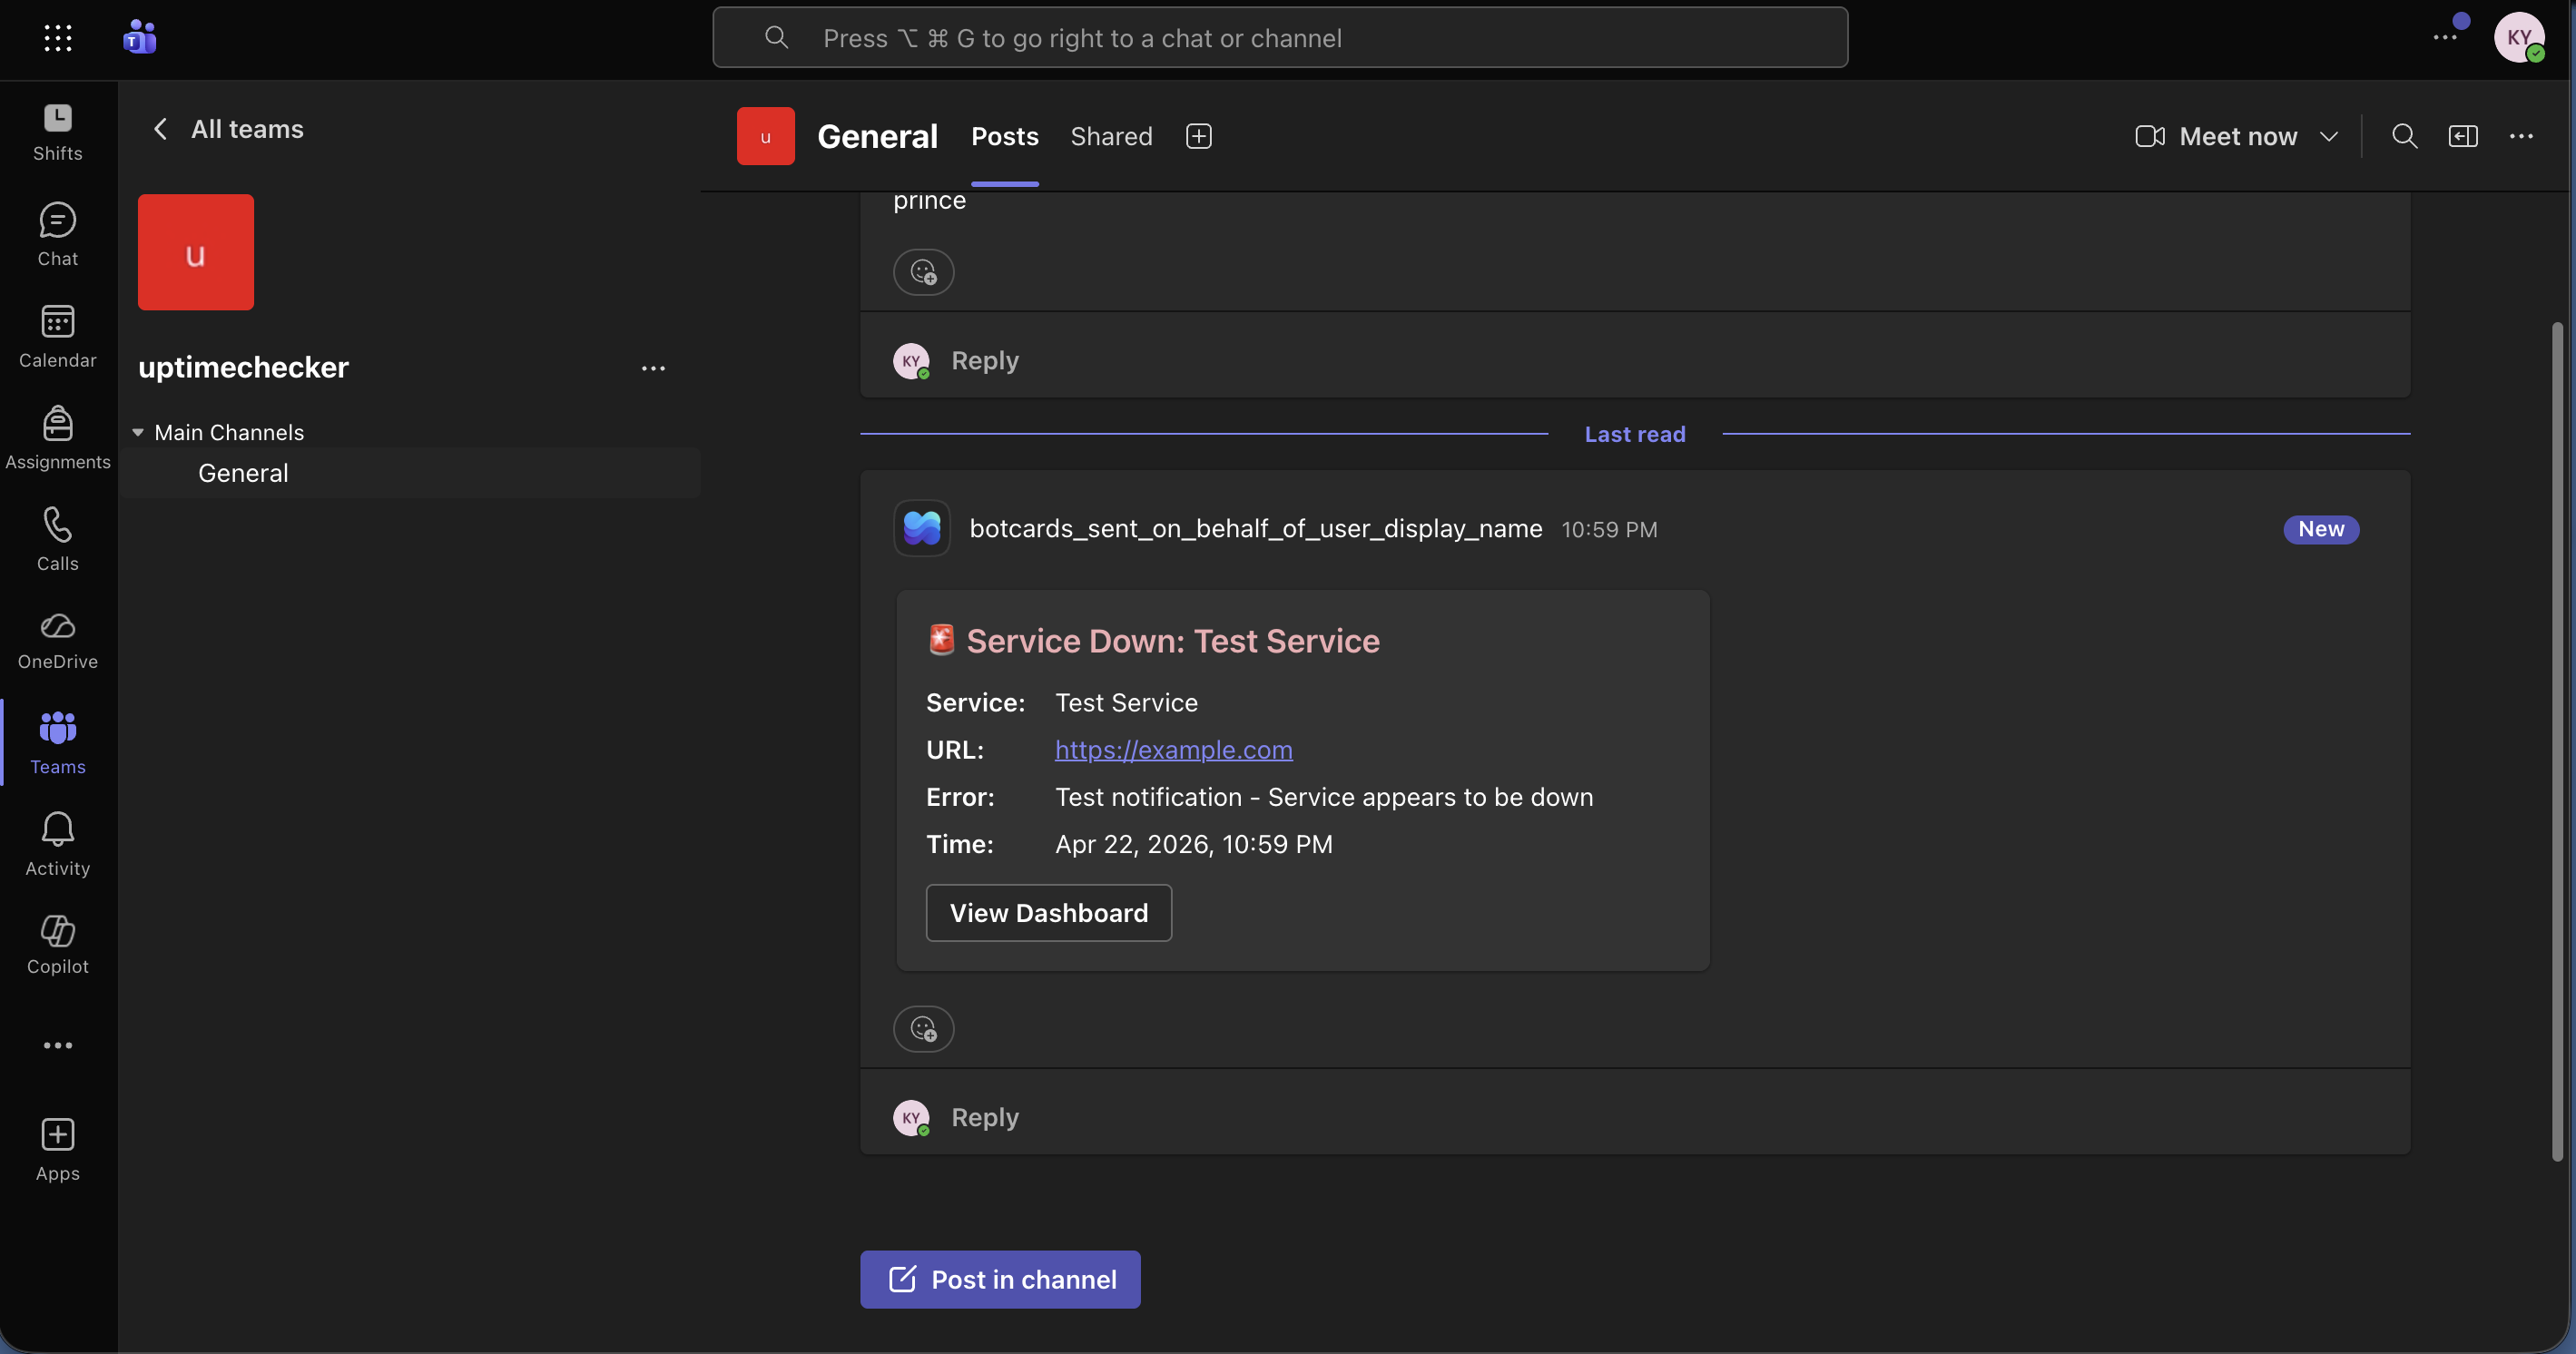
Microsoft Teams
Send automated uptime alerts to any channel via Microsoft Teams Workflows.
API Access
Automate your infrastructure monitoring by integrating UptimeChecker directly into your CI/CD pipelines and internal dashboards using our secure REST API. Available on Pro and Team plans.
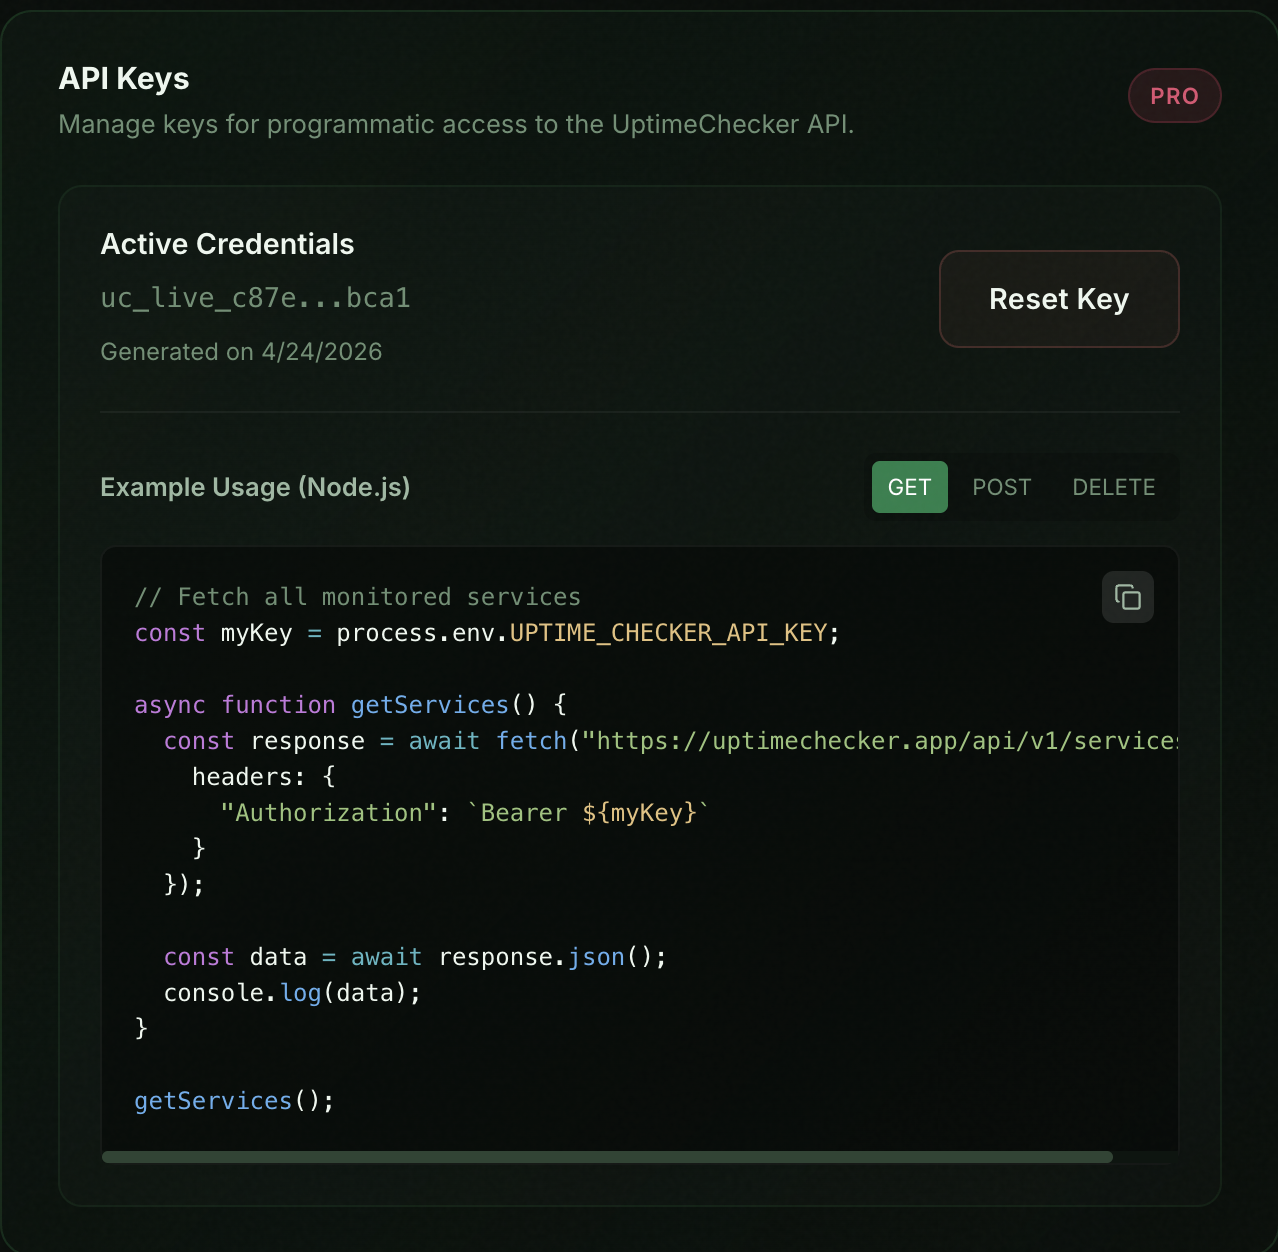
Authentication
Generate your unique API credentials from the Settings dashboard. Save the key as an environment variable (e.g. UPTIME_CHECKER_API_KEY) and pass it as a Bearer token in the `Authorization` header of your HTTP requests.
Endpoint Examples (Node.js)
// Fetch all monitored services
const myKey = process.env.UPTIME_CHECKER_API_KEY;

async function getServices() {
  const response = await fetch("https://www.uptimechecker.app/api/v1/services", {
    headers: {
      "Authorization": `Bearer ${myKey}`
    }
  });

  const data = await response.json();
  console.log(data);
}

getServices();
Automation (CI/CD)
Professional developers don't add services manually. By integrating UptimeChecker into your CI/CD pipeline, you can ensure every new deployment is automatically monitored the second it goes live.
1. Folder Structure
Create a scripts folder at your project root.
my-project/
├── app/
├── scripts/
│   └── register-uptime.js
├── .env
└── package.json
2. Environment
Add your secret API key to your .env file.
UPTIME_CHECKER_API_KEY
=uc_live_...
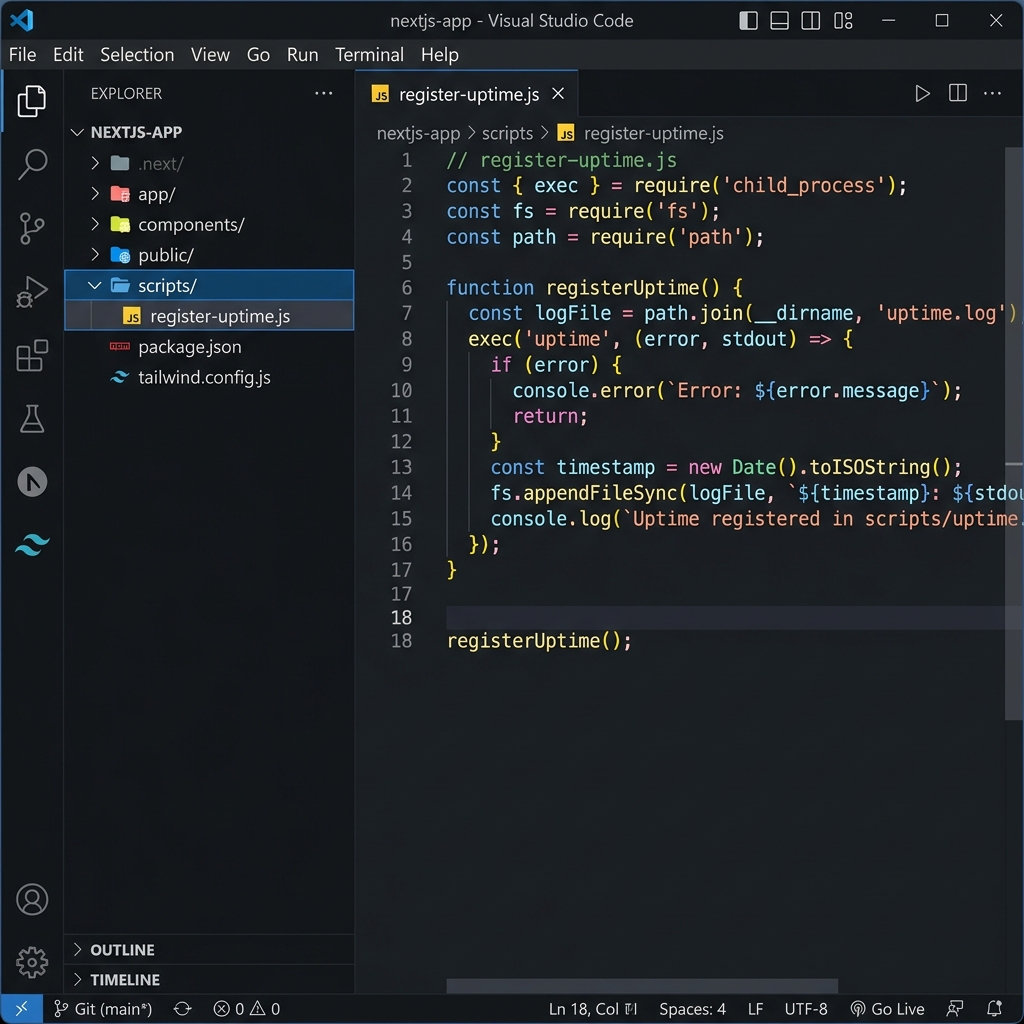
3. Create Script
Add the automation logic to register-uptime.js.
scripts/
└── register-uptime.js
4. Build Script
Trigger the script automatically after build.
"scripts": {
  "build": "next build &&
  node scripts/register-uptime.js"
}
Pro Tip: This script is just a template! You can customize it however you like to fit your project's unique automation needs.
The Automation Script (Vercel)
// scripts/register-uptime.js
const myKey = process.env.UPTIME_CHECKER_API_KEY;

async function register() {
  const response = await fetch("https://www.uptimechecker.app/api/v1/services", {
    method: "POST",
    headers: {
      "Authorization": `Bearer ${myKey}`,
      "Content-Type": "application/json"
    },
    body: JSON.stringify({
      name: "My Vercel App",
      platform: "render",
      url: `https://${process.env.VERCEL_URL}`,
      interval_days: 5
    })
  });

  const data = await response.json();

  if (response.ok) {
    console.log("✅ Successfully registered with UptimeChecker!");
  } else {
    console.error("❌ Registration failed:", data.error || data);
  }
}

register();
GitHub Actions Example
For GitHub Actions, you can use a simple curl command in your workflow YAML file.
- name: Register with UptimeChecker
  run: |
    curl -X POST "https://www.uptimechecker.app/api/v1/services" \
      -H "Authorization: Bearer ${{ secrets.UPTIME_CHECKER_API_KEY }}" \
      -H "Content-Type: application/json" \
      -d '{ "name": "Prod Backend", "platform": "render", "url": "https://api.myapp.com", "interval_days": 1 }'
Billing & Plans
Start for free and upgrade as your infrastructure needs grow. Manage your subscription seamlessly.
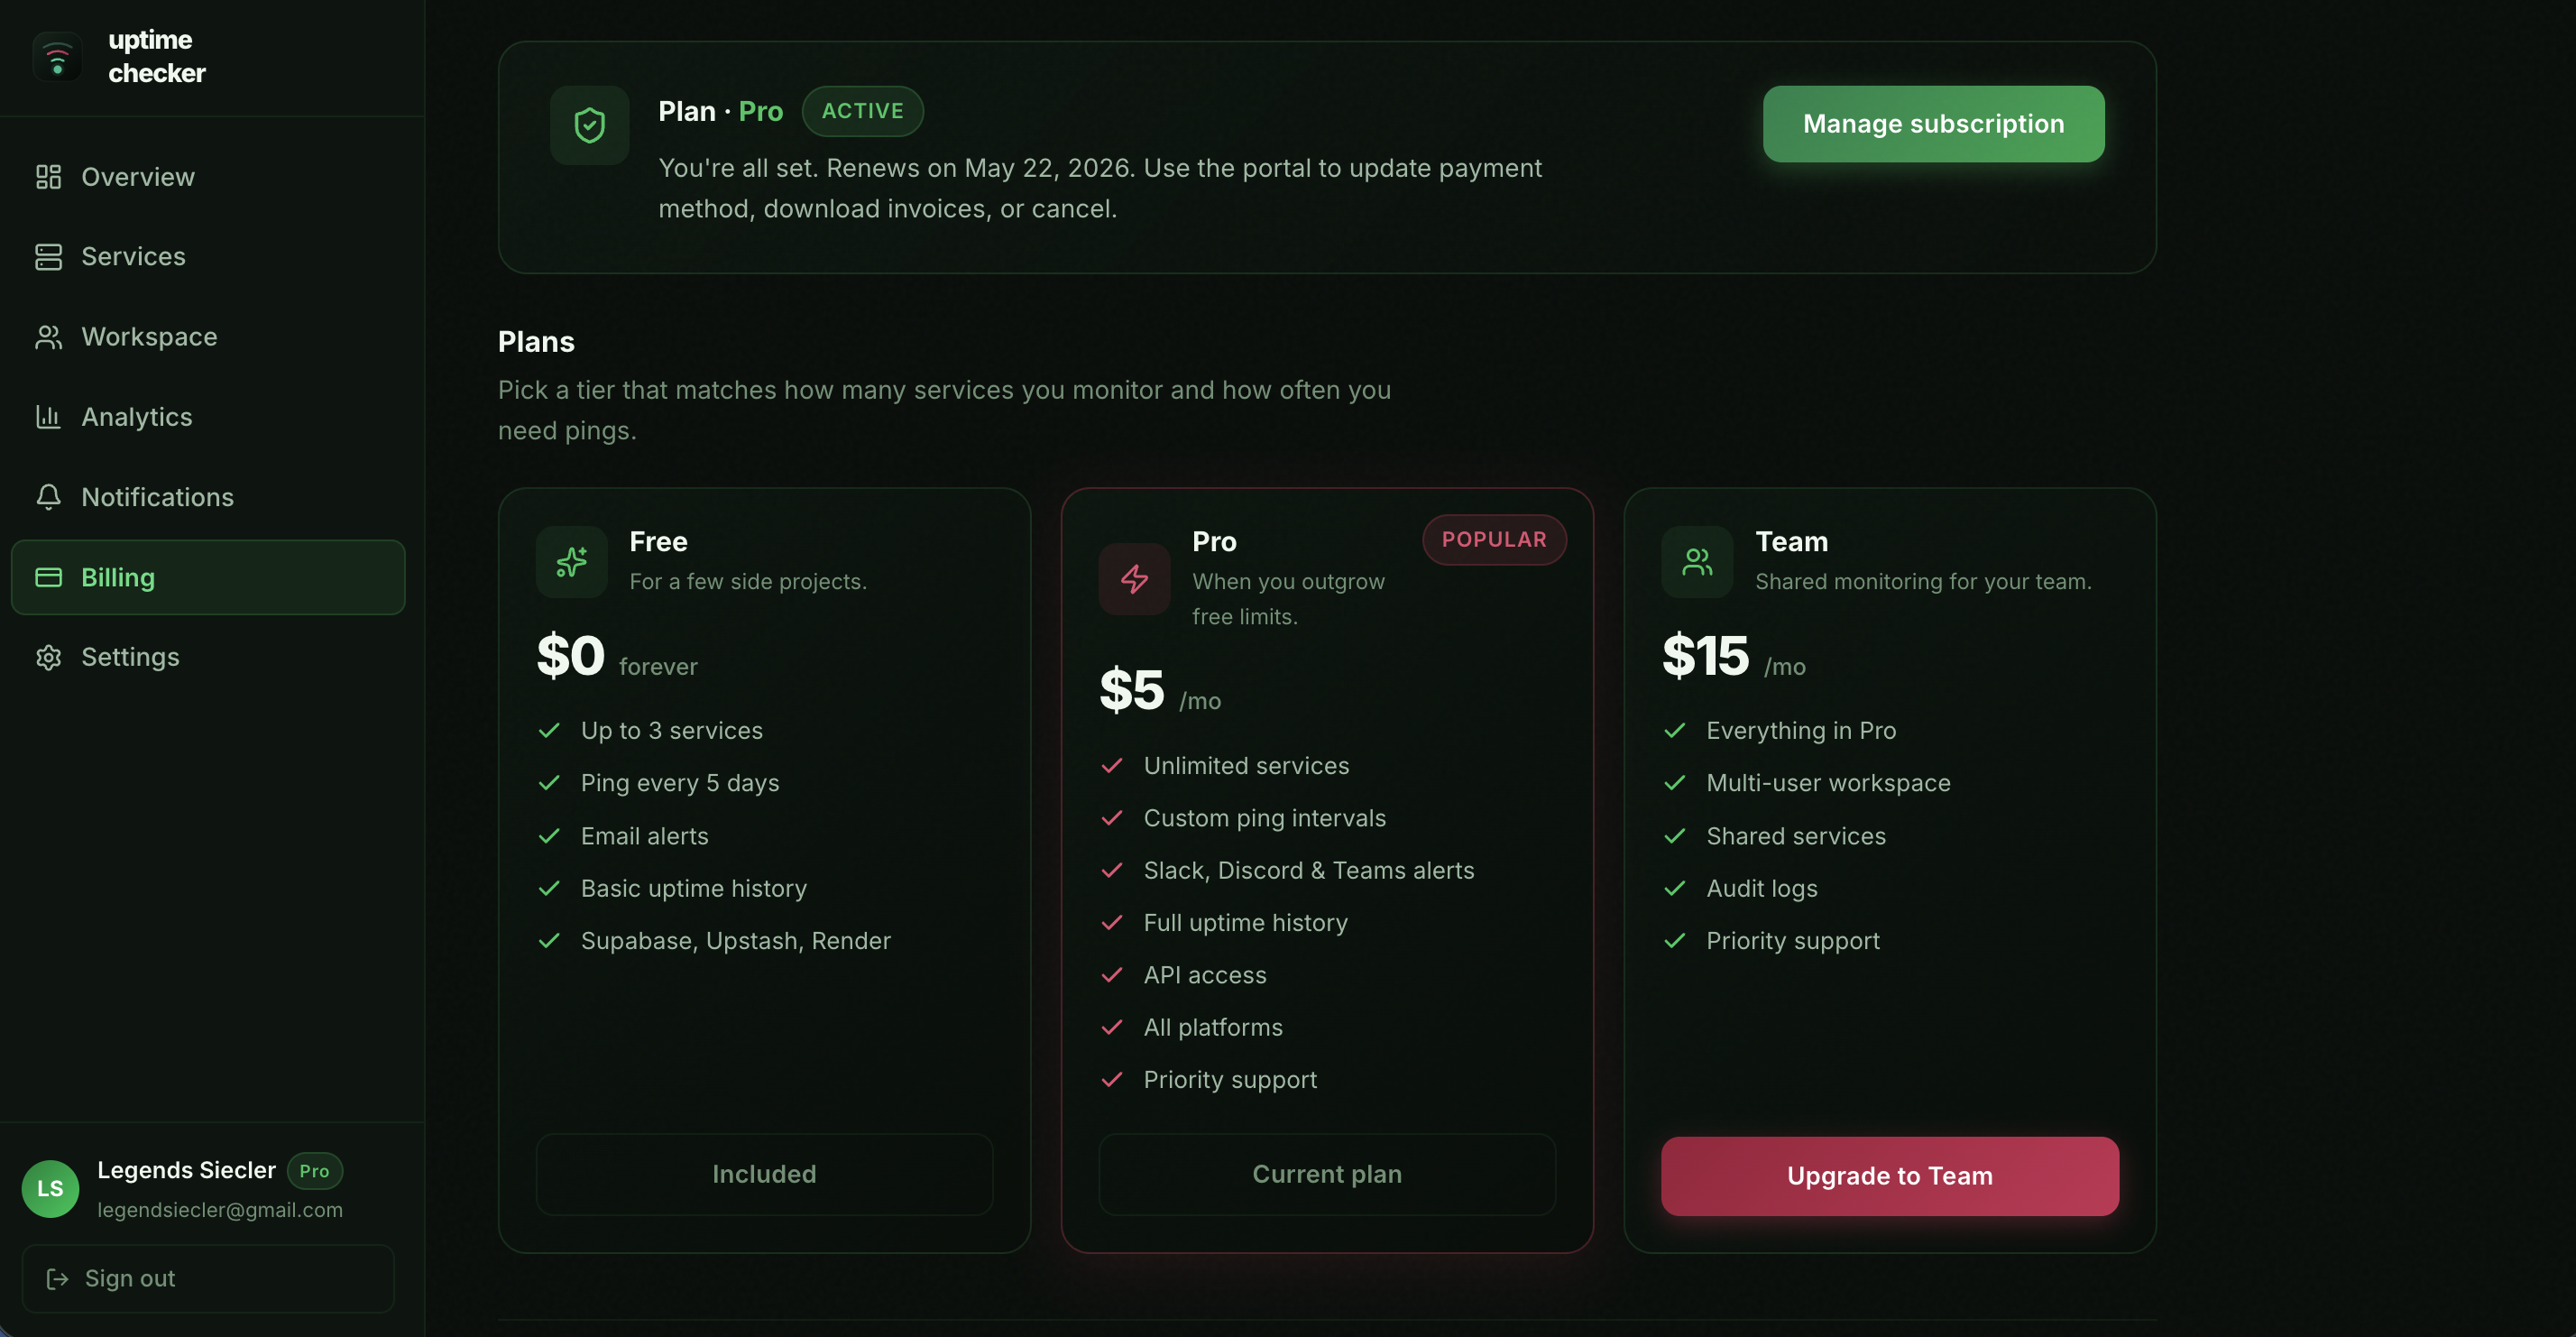
Free Tier
- Up to 3 active services
- 1-14 day intervals
- Email notifications